
+5.30% for Intuit stock — Revenue jump, dividend hike, and buyback fuel rally

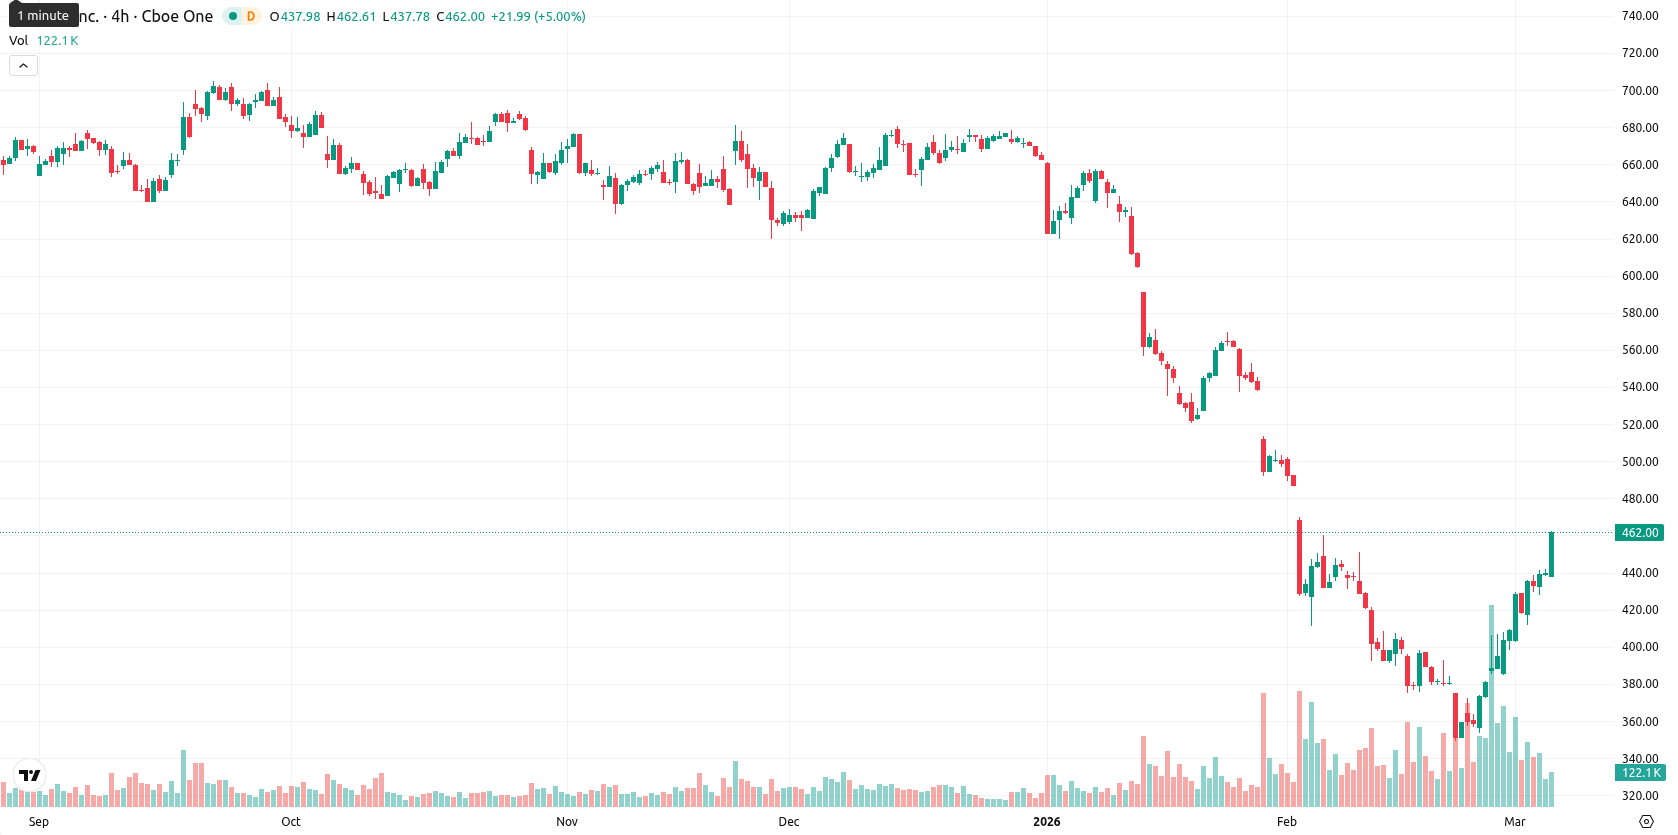
Intuit Inc. (INTU) is trading at $463.64, which is well above the 20-day Moving Average ($405.31), but remains below the 50-day ($519.74) and 200-day ($657.10) Moving Averages. The price is also above the Ichimoku Kijun level ($455.29), highlighting this level as immediate support.
Highlights
- Intuit delivered strong Q2 2026 results, with $4.65 billion revenue up 17% and non-GAAP EPS increasing 25% year-over-year.
- The company raised its dividend by 15% and deepened its AI strategy through a multiyear Anthropic partnership.
- Technical signals are mixed; despite a short-term rally, medium-term indicators point to potential downside with an expected $445–$480 trading range.
Dividend growth and AI partnership drive investor confidence
On February 26, 2026, Intuit reported fiscal Q2 2026 revenue of $4.65 billion, a 17% year-over-year increase, and non-GAAP EPS of $4.15, up 25%. The company raised its quarterly dividend by 15% to $1.20 per share and continued a 14-year streak of dividend growth, alongside repurchasing $961 million in shares. Intuit also began a multiyear partnership with Anthropic to boost its AI-driven financial software offerings.
Mixed momentum signals as intraday strength meets resistance
Momentum on the daily timeframe for INTU is mixed, with MACD and ADX both signaling a sell, pointing to weak upside momentum. Oscillators show divergence: RSI shows a sell signal, Stochastic RSI is overbought, Commodity Channel Index is in buy territory, and Bull/Bear Power indicates strong buyer dominance intraday. The current price sits near today’s high following a strong intraday rally, but this short-term strength contrasts with mixed-to-negative medium-term momentum signals. Support lies at the Ichimoku Kijun level ($455), with resistance seen around $480.
Low breakout odds as consolidation expected within tight range
Looking ahead, the expected price range for INTU over the next five trading days is $445 – $480, reflecting typical weekly volatility for a large-cap stock. Technical signals from Moving Averages, RSI, ADX, and MACD suggest a low probability (less than 20%) of a sustained price increase and a higher likelihood of a decline. The baseline scenario anticipates sideways trading between support near $455 and resistance around $480, while a bullish breakout above $480 could trigger further short covering and a move higher. Renewed bearish momentum below $445 may expose INTU to additional downside correction.
Last time, analysts noted that Intuit Inc. continues to trade well below its key moving averages, with technical indicators such as the MACD and ADX confirming persistent bearish momentum, while RSI and CCI indicate mildly oversold conditions. The price is expected to fluctuate sideways within a wide range, with a bearish outlook favored and key support near $373.00 amid elevated volatility.


-
 Afghanistan
-
 Albania
-
 Algeria
-
 Angola
-
 Argentina
-
 Armenia
-
 Australia
-
 Austria
-
 Azerbaijan
-
 Bahamas
-
 Bahrain
-
 Bangladesh
-
 Belarus
-
 Belgium
-
 Bolivia
-
 Botswana
-
 Brazil
-
 Brunei
-
 Bulgaria
-
 Cambodia
-
 Cameroon
-
 Canada
-
 Chile
Chile
-
 China
China
-
 Colombia
-
 Congo
Congo
-
 Costa Rica
-
 Cote d'Ivoire
-
 Croatia
-
 Cuba
Cuba
-
 Cyprus
-
 Czechia
-
 DR Congo
-
 Denmark
-
 Dominican Republic
-
 Ecuador
-
 Egypt
Egypt
-
 El Salvador
-
 Estonia
-
 Eswatini
-
 Ethiopia
-
 Finland
-
 France
-
 Georgia
-
 Germany
-
 Ghana
Ghana
-
 Greece
-
 Haiti
Haiti
-
 Hong Kong
-
 Hungary
-
 India
India
-
 Indonesia
-
 Iran, Islamic republic
-
 Iraq
Iraq
-
 Ireland
-
 Israel
-
 Italy
Italy
-
 Jamaica
-
 Japan
Japan
-
 Jordan
-
 Kazakhstan
-
 Kenya
Kenya
-
 Korea
Korea
-
 Kuwait
-
 Kyrgyzstan
-
 Laos
Laos
-
 Latvia
-
 Lebanon
-
 Lesotho
-
 Libya
Libya
-
 Lithuania
-
 Luxembourg
-
 Madagascar
-
 Malaysia
-
 Malta
Malta
-
 Mauritius
-
 Mexico
-
 Moldova
-
 Mongolia
-
 Montenegro
-
 Morocco
-
 Mozambique
-
 Myanmar
-
 Namibia
-
 Nepal
Nepal
-
 Netherlands
-
 New Zealand
-
 Nigeria
-
 North Macedonia
-
 Norway
-
 Oman
Oman
-
 Pakistan
-
 Palestine
-
 Panama
-
 Papua New Guinea
-
 Paraguay
-
 Peru
Peru
-
 Philippines
-
 Poland
-
 Portugal
-
 Puerto Rico
-
 Qatar
Qatar
-
 Reunion
-
 Romania
-
 Rwanda
-
 Saudi Arabia
-
 Serbia
-
 Singapore
-
 Slovakia
-
 Slovenia
-
 Somalia
-
 South Africa
-
 Spain
Spain
-
 Sri Lanka
-
 Sweden
-
 Switzerland
-
 Syria
Syria
-
 Taiwan
-
 Tajikistan
-
 Tanzania
-
 Thailand
-
 Trinidad and Tobago
-
 Tunisia
-
 Turkey
-
 UAE
UAE
-
 Uganda
-
 Ukraine
-
 United Kingdom
-
United States
-
 Uruguay
-
 Uzbekistan
-
 Venezuela
-
 Vietnam
-
 Yemen
Yemen
-
 Zambia
-
 Zimbabwe
- Forex
- Crypto
