
New high-fee Platinum card launch and weak technicals — Robinhood stock slides 3.64%

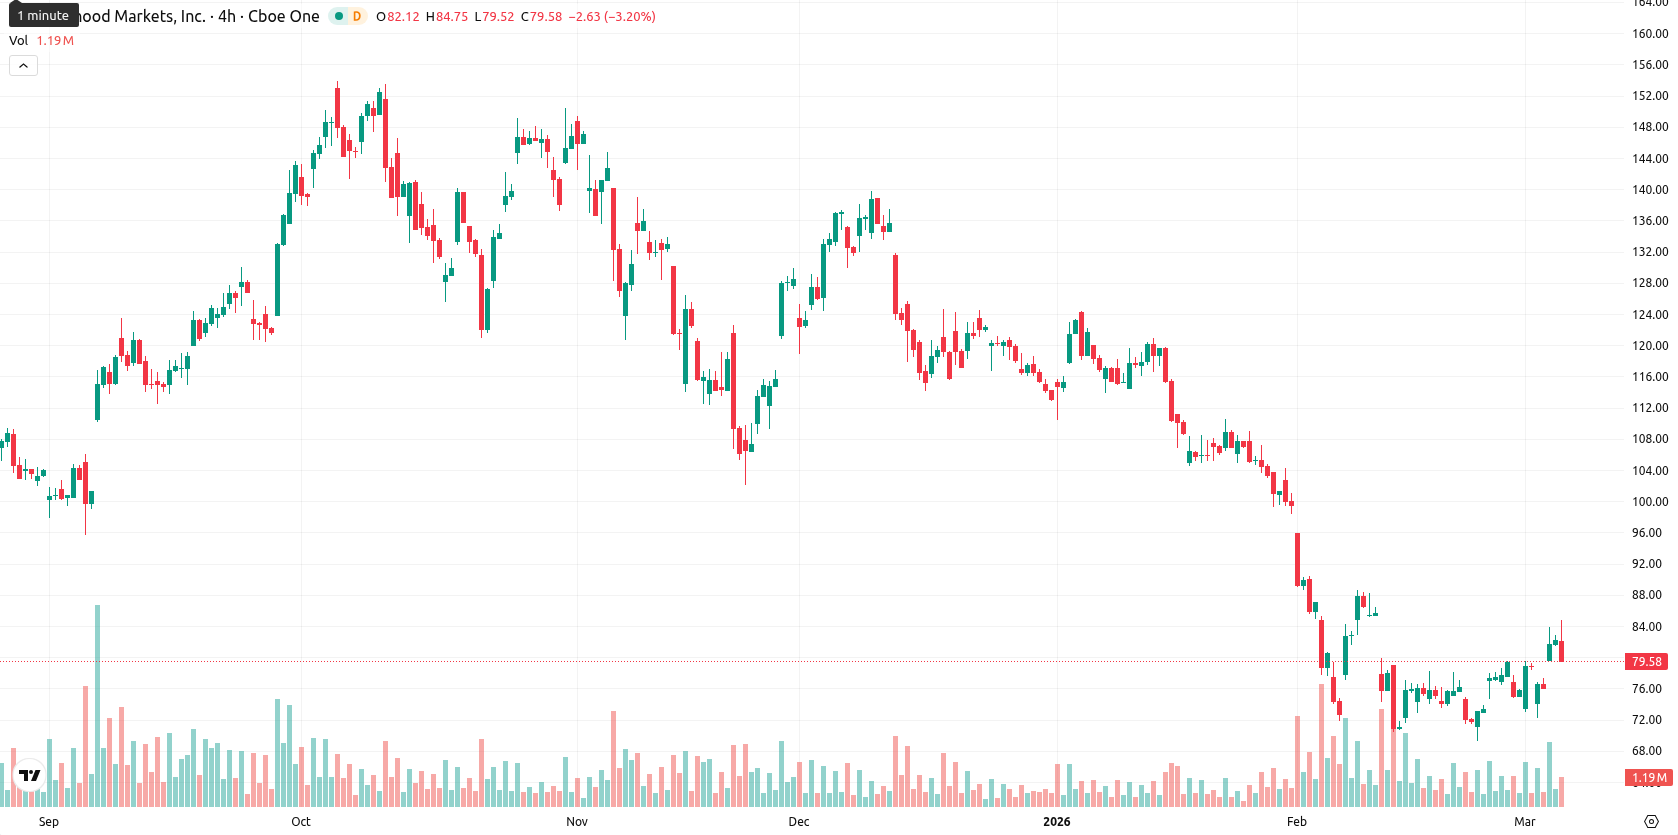
Robinhood Markets Inc (HOOD) is trading at $79.22 after a daily drop of 3.64%. The price stands just above the MA-20 ($77.54), but remains well below both the MA-50 ($98.04) and MA-200 ($107.19), indicating short-term buying amid continued medium- and long-term bearish pressure.
Highlights
- Robinhood launched a premium $695 annual Platinum credit card and new account services targeting affluent users and expanded platform features.
- ARK Invest bought approximately $12 million of Robinhood stock across several ETFs prior to these launches, amid broader market selling pressure.
- Technical analysis signals short-term buying amid persistent bearish momentum, with an expected five-day trading range of $75.00–$83.00 and low probability of near-term price recovery.
Broader selling pressure as new products and ARK Invest flows intersect
On Wednesday, Robinhood introduced its new Platinum credit card aimed at high-income customers, offering a range of benefits and carrying a $695 annual fee. The company also announced trust and custodial accounts, upgrades to its Robinhood Strategies platform, and an upcoming Early Dividends service expected by April. Prior to these product launches, ARK Invest acquired around $12 million in Robinhood shares across several ETFs. These developments were accompanied by broader selling pressure.
Bearish technical momentum with resistance and overbought risk signals
The current price is just above the MA-20 ($77.54), but remains well below the MA-50 ($98.04) and MA-200 ($107.19), with the Ichimoku Kijun at $89.14 acting as immediate resistance. Momentum indicators show a predominantly negative tilt: the MACD signals a strong sell, the ADX confirms a trend-defining bearish outlook, and the RSI is near neutral at 47.47 but leans bearish. The Stochastic RSI is fully overbought at 100, highlighting potential for a near-term reversal, while the CCI is moderately bullish at 95.80. Bull/Bear Power is overbought, and the Awesome Oscillator is neutral, indicating increased risk and persistent selling pressure.
Low upside odds as weak signals heighten risk of further decline
Over the next five trading days, HOOD is expected to move within a volatility band between $75.00 and $83.00 relative to current levels. The probability of further price increase is seen as very low (less than 20%) given the lack of bullish signals across key weekly technical indicators, increasing the likelihood of a downward move. The baseline scenario points to consolidative sideways action as buyers and sellers compete for direction. Should a bullish reversal occur, a breakout above the Ichimoku Kijun ($89) could trigger upward momentum, while a drop below $75 would likely bring renewed selling pressure.
Previously it was reported that Robinhood Markets Inc. is trading below key moving averages and dynamic resistance, with persistent bearish momentum confirmed by negative MACD, weak RSI, and sustained downtrend signals from the ADX. Despite intensive selling pressure and anticipation around new product announcements, intraday support holds near recent lows while mixed oscillator readings suggest a risk of short-term reversal within the prevailing downtrend.


Latest Robinhood News


-
 Afghanistan
-
 Albania
-
 Algeria
-
 Angola
-
 Argentina
-
 Armenia
-
 Australia
-
 Austria
-
 Azerbaijan
-
 Bahamas
-
 Bahrain
-
 Bangladesh
-
 Belarus
-
 Belgium
-
 Bolivia
-
 Botswana
-
 Brazil
-
 Brunei
-
 Bulgaria
-
 Cambodia
-
 Cameroon
-
 Canada
-
 Chile
Chile
-
 China
China
-
 Colombia
-
 Congo
Congo
-
 Costa Rica
-
 Cote d'Ivoire
-
 Croatia
-
 Cuba
Cuba
-
 Cyprus
-
 Czechia
-
 DR Congo
-
 Denmark
-
 Dominican Republic
-
 Ecuador
-
 Egypt
Egypt
-
 El Salvador
-
 Estonia
-
 Eswatini
-
 Ethiopia
-
 Finland
-
 France
-
 Georgia
-
 Germany
-
 Ghana
Ghana
-
 Greece
-
 Haiti
Haiti
-
 Hong Kong
-
 Hungary
-
 India
India
-
 Indonesia
-
 Iran, Islamic republic
-
 Iraq
Iraq
-
 Ireland
-
 Israel
-
 Italy
Italy
-
 Jamaica
-
 Japan
Japan
-
 Jordan
-
 Kazakhstan
-
 Kenya
Kenya
-
 Korea
Korea
-
 Kuwait
-
 Kyrgyzstan
-
 Laos
Laos
-
 Latvia
-
 Lebanon
-
 Lesotho
-
 Libya
Libya
-
 Lithuania
-
 Luxembourg
-
 Madagascar
-
 Malaysia
-
 Malta
Malta
-
 Mauritius
-
 Mexico
-
 Moldova
-
 Mongolia
-
 Montenegro
-
 Morocco
-
 Mozambique
-
 Myanmar
-
 Namibia
-
 Nepal
Nepal
-
 Netherlands
-
 New Zealand
-
 Nigeria
-
 North Macedonia
-
 Norway
-
 Oman
Oman
-
 Pakistan
-
 Palestine
-
 Panama
-
 Papua New Guinea
-
 Paraguay
-
 Peru
Peru
-
 Philippines
-
 Poland
-
 Portugal
-
 Puerto Rico
-
 Qatar
Qatar
-
 Reunion
-
 Romania
-
 Rwanda
-
 Saudi Arabia
-
 Serbia
-
 Singapore
-
 Slovakia
-
 Slovenia
-
 Somalia
-
 South Africa
-
 Spain
Spain
-
 Sri Lanka
-
 Sweden
-
 Switzerland
-
 Syria
Syria
-
 Taiwan
-
 Tajikistan
-
 Tanzania
-
 Thailand
-
 Trinidad and Tobago
-
 Tunisia
-
 Turkey
-
 UAE
UAE
-
 Uganda
-
 Ukraine
-
 United Kingdom
-
United States
-
 Uruguay
-
 Uzbekistan
-
 Venezuela
-
 Vietnam
-
 Yemen
Yemen
-
 Zambia
-
 Zimbabwe
- Forex
- Crypto
