
Hut 8 stock rises 3.48% as institutional investors drive renewed buying interest

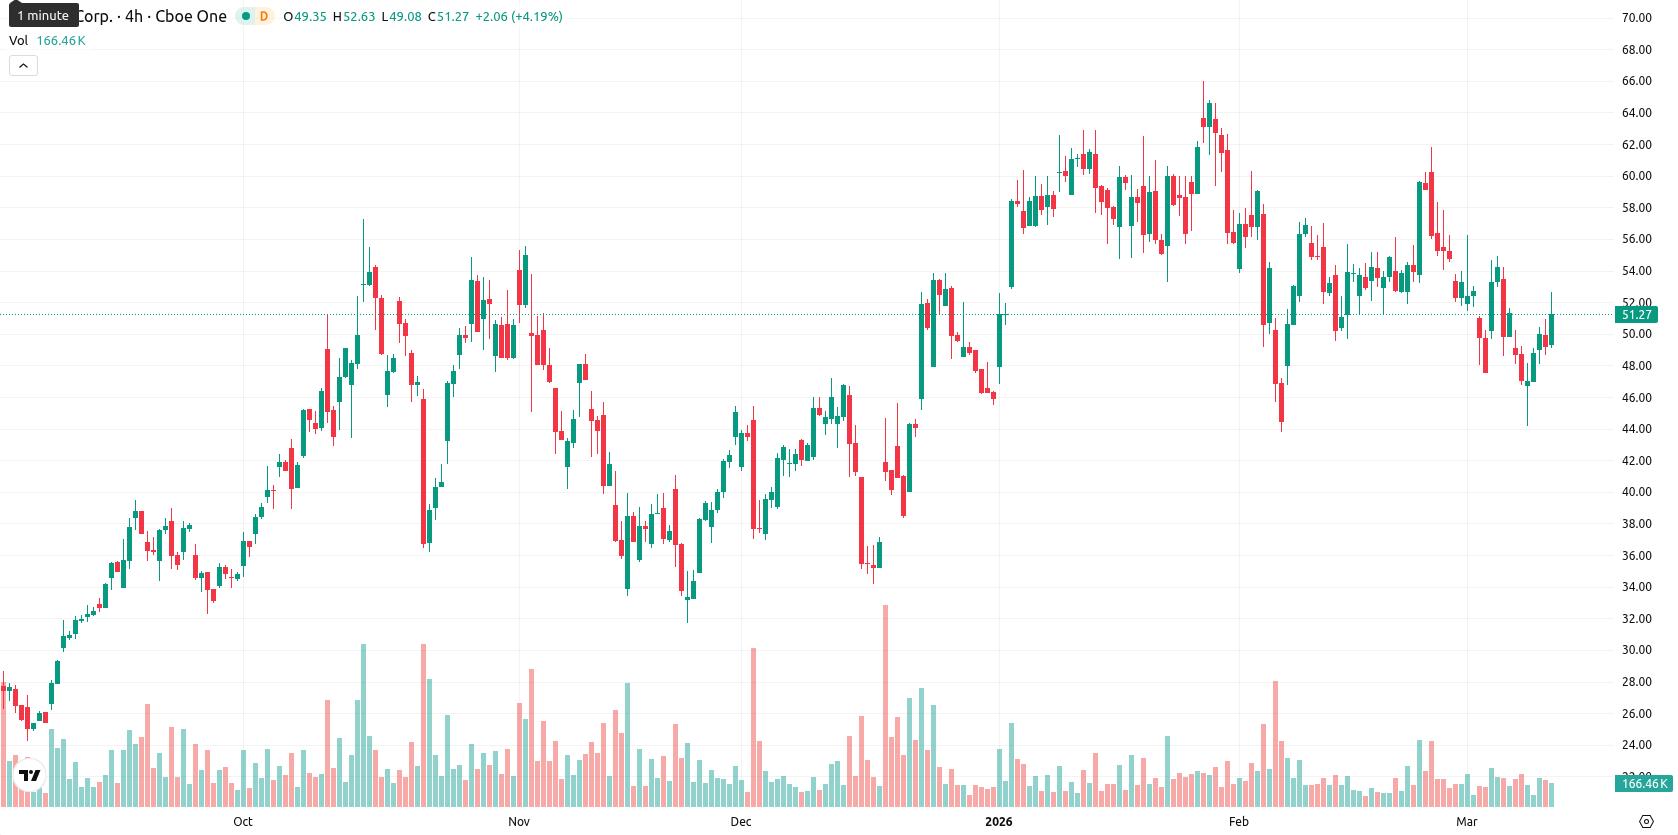
Hut 8 Corp (HUT) is trading at $50.89 after moving up 3.48% over the session. The asset currently sits below both its SMA-20 ($52.78) and SMA-50 ($54.85), yet remains well above the SMA-200 at $37.23, highlighting persistent seller pressure in the short and medium term but sustained long-term support. Immediate resistance is marked by the Ichimoku Kijun level at $52.82.
Highlights
- Hut 8 is pivoting to high-growth sectors, securing an inaugural AI data center contract with Fluidstack and Anthropic and separating legacy mining into American Bitcoin.
- Institutional ownership surged from under 10% to approximately 70%, fueling renewed buying interest in HUT shares.
- HUT trades in a $46.00–$54.95 range with short-term downward pressure, but dominant weekly bullish signals suggest high probability of further upside.
Strategic pivot and institutional demand drive renewed HUT buying
Hut 8 has recently held its Q4 earnings call, outlining a strategic shift into high-growth sectors. The company announced the separation of legacy mining operations into American Bitcoin and reported its inaugural AI data center contract with Fluidstack and Anthropic, as well as a broader collaboration with Anthropic. Operational improvements were cited, alongside a significant increase in institutional ownership from under 10% to around 70%. These developments are supporting renewed buying interest in HUT.
Mixed technical signals amid weak momentum and oversold readings
Short- and medium-term technical momentum for HUT remains weak, with the price below the SMA-20 and SMA-50 but well above the SMA-200, confirming underlying long-term support. The daily Ichimoku Kijun line at $52.82 is acting as immediate resistance. Momentum signals are mixed: the MACD shows cooling momentum and a Sell signal, ADX is neutral at 8.99, and oversold readings from both RSI (44.94) and CCI (–111.97) are reinforced by BBP, which indicates dominant seller pressure. The Stoch RSI is neutral, while the Awesome Oscillator lacks a clear trend, and intraday volatility has remained moderate with a neutral-to-cautious tone. Oscillator divergence signals some emerging buy activity on shorter timeframes, while daily signals still reflect buyer hesitation.
Bullish breakout favored as weekly indicators support upside
Over the next five sessions, HUT is expected to trade within a typical volatility band of $46.00 to $54.95 relative to the current $50.89 price. The probability of a further rise is high (above 80%) as supported by dominant weekly Buy signals in RSI, ADX, MACD, and the MA-50, with a pullback appearing less likely. The base case scenario is for consolidation within this range just below resistance. A bullish breakout above the Kijun and session highs targets $54.95, while a drop below $46.00 could trigger additional downside, though current weekly momentum signals do not suggest this as the primary scenario.
Previously it was reported that Hut 8 Corp. is seeing short- and medium-term selling pressure as it trades below its 20- and 50-day moving averages but remains well supported above its 200-day moving average, reflecting underlying long-term strength despite near-term headwinds. Technical indicators are mixed, with negative MACD, weak ADX, and oversold CCI contrasting with a late-session price rebound and emerging buyer interest near technical resistance around $53 and support in the $48–$49 range.


-
 Afghanistan
-
 Albania
-
 Algeria
-
 Angola
-
 Argentina
-
 Armenia
-
 Australia
-
 Austria
-
 Azerbaijan
-
 Bahamas
-
 Bahrain
-
 Bangladesh
-
 Belarus
-
 Belgium
-
 Bolivia
-
 Botswana
-
 Brazil
-
 Brunei
-
 Bulgaria
-
 Cambodia
-
 Cameroon
-
 Canada
-
 Chile
Chile
-
 China
China
-
 Colombia
-
 Congo
Congo
-
 Costa Rica
-
 Cote d'Ivoire
-
 Croatia
-
 Cuba
Cuba
-
 Cyprus
-
 Czechia
-
 DR Congo
-
 Denmark
-
 Dominican Republic
-
 Ecuador
-
 Egypt
Egypt
-
 El Salvador
-
 Estonia
-
 Eswatini
-
 Ethiopia
-
 Finland
-
 France
-
 Georgia
-
 Germany
-
 Ghana
Ghana
-
 Greece
-
 Haiti
Haiti
-
 Hong Kong
-
 Hungary
-
 India
India
-
 Indonesia
-
 Iran, Islamic republic
-
 Iraq
Iraq
-
 Ireland
-
 Israel
-
 Italy
Italy
-
 Jamaica
-
 Japan
Japan
-
 Jordan
-
 Kazakhstan
-
 Kenya
Kenya
-
 Korea
Korea
-
 Kuwait
-
 Kyrgyzstan
-
 Laos
Laos
-
 Latvia
-
 Lebanon
-
 Lesotho
-
 Libya
Libya
-
 Lithuania
-
 Luxembourg
-
 Madagascar
-
 Malaysia
-
 Malta
Malta
-
 Mauritius
-
 Mexico
-
 Moldova
-
 Mongolia
-
 Montenegro
-
 Morocco
-
 Mozambique
-
 Myanmar
-
 Namibia
-
 Nepal
Nepal
-
 Netherlands
-
 New Zealand
-
 Nigeria
-
 North Macedonia
-
 Norway
-
 Oman
Oman
-
 Pakistan
-
 Palestine
-
 Panama
-
 Papua New Guinea
-
 Paraguay
-
 Peru
Peru
-
 Philippines
-
 Poland
-
 Portugal
-
 Puerto Rico
-
 Qatar
Qatar
-
 Reunion
-
 Romania
-
 Rwanda
-
 Saudi Arabia
-
 Serbia
-
 Singapore
-
 Slovakia
-
 Slovenia
-
 Somalia
-
 South Africa
-
 Spain
Spain
-
 Sri Lanka
-
 Sweden
-
 Switzerland
-
 Syria
Syria
-
 Taiwan
-
 Tajikistan
-
 Tanzania
-
 Thailand
-
 Trinidad and Tobago
-
 Tunisia
-
 Turkey
-
 UAE
UAE
-
 Uganda
-
 Ukraine
-
 United Kingdom
-
United States
-
 Uruguay
-
 Uzbekistan
-
 Venezuela
-
 Vietnam
-
 Yemen
Yemen
-
 Zambia
-
 Zimbabwe
- Forex
- Crypto
