
Quantum Computing stock drops 3.82% as downside momentum persists below key averages

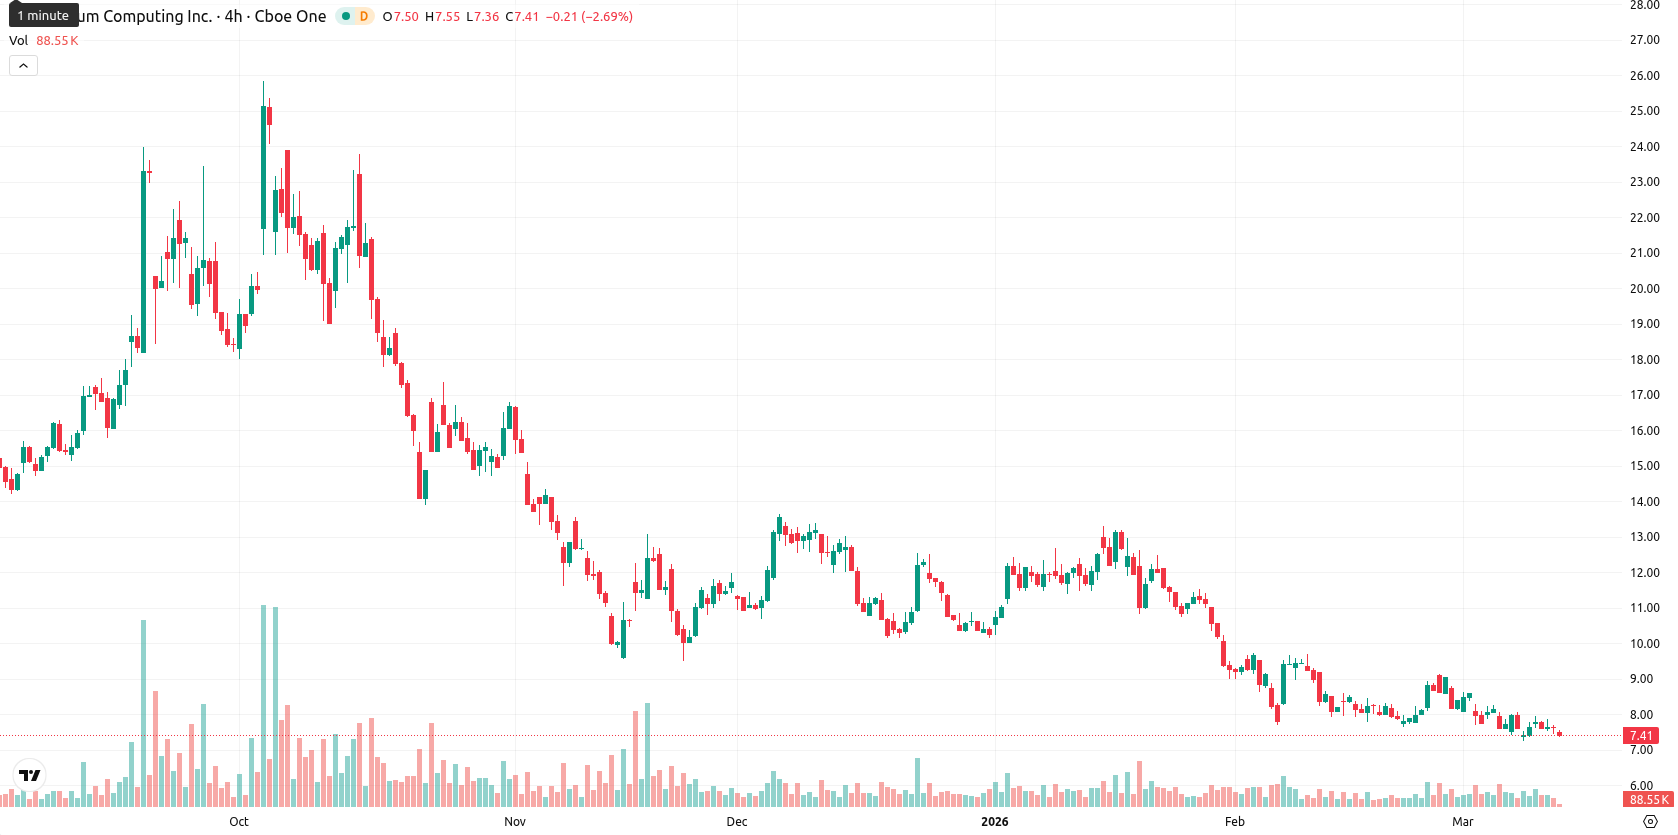
Quantum Computing Inc. (QUBT) is trading at $7.33 after a daily decline of 3.82%. The price is positioned below its SMA-20 ($8.12), SMA-50 ($9.77), and SMA-200 ($14.29) moving averages, indicating continued downside momentum and sustained pressure relative to major trend indicators.
Highlights
- QUBT trades under major moving averages, indicating persistent downward momentum across multiple timeframes.
- Momentum and oscillator indicators collectively signal dominant selling pressure, with oversold conditions and no bullish divergences.
- Price expected to move sideways within a $7.10–$7.80 corridor; sub-$7.10 could trigger further downside, upside limited unless $8.48 resistance breaks.
Bearish signals dominate as technical barriers and momentum weaken
QUBT remains under notable technical pressure, with price action suppressed under all key daily moving averages and close to today's session low of $7.35. The Ichimoku Kijun line on the daily chart acts as nearby resistance at $8.48. Momentum indicators signal persistent bearishness: MACD stays in strong sell mode, ADX reflects prevailing selling strength, and all intraday oscillators (RSI below 40, CCI and BBP both oversold, Stoch RSI lacking bullish momentum) align to the downside. The Awesome Oscillator is neutral, but intraday price development shows continual selling interest with moderate volatility.
Limited upside as volatility bands constrain near-term outlook
For the next five trading days, QUBT is expected to remain within a typical volatility band between $7.10 and $7.80. The probability of a short-term price increase is low, likely less than 20%. The baseline scenario forecasts sideways movement within this corridor. Any upside potential would require a close above $8.48, but a break below $7.10 support could trigger an acceleration of bearish momentum.
Previously it was reported that Quantum Computing Inc. (QUBT) continues to exhibit a persistent bearish trend, trading below key short-, medium-, and long-term moving averages, with intensified selling pressure underscored by negative momentum signals from MACD, ADX, and a sub-40 RSI. The stock remains under resistance near $8.48 amid weak intraday performance, as multiple technical oscillators—including CCI and Stoch RSI—reinforce prevailing downside risk.


Latest Quantum Computing News


-
 Afghanistan
-
 Albania
-
 Algeria
-
 Angola
-
 Argentina
-
 Armenia
-
 Australia
-
 Austria
-
 Azerbaijan
-
 Bahamas
-
 Bahrain
-
 Bangladesh
-
 Belarus
-
 Belgium
-
 Bolivia
-
 Botswana
-
 Brazil
-
 Brunei
-
 Bulgaria
-
 Cambodia
-
 Cameroon
-
 Canada
-
 Chile
Chile
-
 China
China
-
 Colombia
-
 Congo
Congo
-
 Costa Rica
-
 Cote d'Ivoire
-
 Croatia
-
 Cuba
Cuba
-
 Cyprus
-
 Czechia
-
 DR Congo
-
 Denmark
-
 Dominican Republic
-
 Ecuador
-
 Egypt
Egypt
-
 El Salvador
-
 Estonia
-
 Eswatini
-
 Ethiopia
-
 Finland
-
 France
-
 Georgia
-
 Germany
-
 Ghana
Ghana
-
 Greece
-
 Haiti
Haiti
-
 Hong Kong
-
 Hungary
-
 India
India
-
 Indonesia
-
 Iran, Islamic republic
-
 Iraq
Iraq
-
 Ireland
-
 Israel
-
 Italy
Italy
-
 Jamaica
-
 Japan
Japan
-
 Jordan
-
 Kazakhstan
-
 Kenya
Kenya
-
 Korea
Korea
-
 Kuwait
-
 Kyrgyzstan
-
 Laos
Laos
-
 Latvia
-
 Lebanon
-
 Lesotho
-
 Libya
Libya
-
 Lithuania
-
 Luxembourg
-
 Madagascar
-
 Malaysia
-
 Malta
Malta
-
 Mauritius
-
 Mexico
-
 Moldova
-
 Mongolia
-
 Montenegro
-
 Morocco
-
 Mozambique
-
 Myanmar
-
 Namibia
-
 Nepal
Nepal
-
 Netherlands
-
 New Zealand
-
 Nigeria
-
 North Macedonia
-
 Norway
-
 Oman
Oman
-
 Pakistan
-
 Palestine
-
 Panama
-
 Papua New Guinea
-
 Paraguay
-
 Peru
Peru
-
 Philippines
-
 Poland
-
 Portugal
-
 Puerto Rico
-
 Qatar
Qatar
-
 Reunion
-
 Romania
-
 Rwanda
-
 Saudi Arabia
-
 Serbia
-
 Singapore
-
 Slovakia
-
 Slovenia
-
 Somalia
-
 South Africa
-
 Spain
Spain
-
 Sri Lanka
-
 Sweden
-
 Switzerland
-
 Syria
Syria
-
 Taiwan
-
 Tajikistan
-
 Tanzania
-
 Thailand
-
 Trinidad and Tobago
-
 Tunisia
-
 Turkey
-
 UAE
UAE
-
 Uganda
-
 Ukraine
-
 United Kingdom
-
United States
-
 Uruguay
-
 Uzbekistan
-
 Venezuela
-
 Vietnam
-
 Yemen
Yemen
-
 Zambia
-
 Zimbabwe
- Forex
- Crypto
