
Intel stock falls 3.74% as legal risk and technical signals spur selling

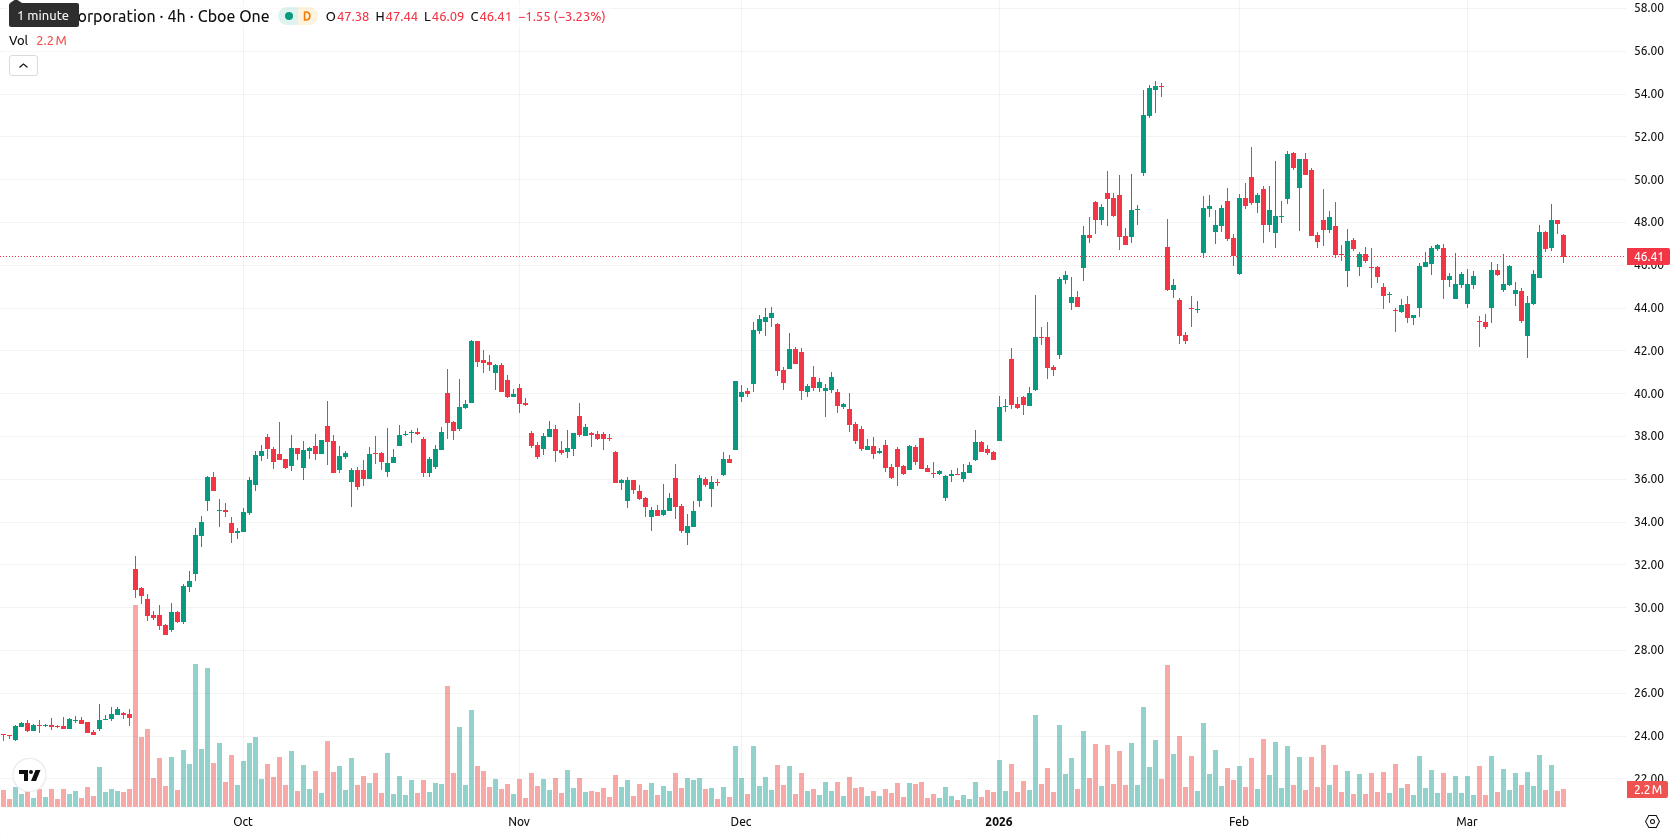
Intel Corporation (INTC) is trading at $46.19, down 3.74% on the day. The current price remains above both the MA-20 ($45.67) and MA-50 ($45.67) and is well above the MA-200 ($33.31), reflecting a continued bullish bias across all major moving averages.
Highlights
- Intel faces a lawsuit alleging its board granted a 10% equity stake to the U.S. government over political concerns.
- Major institutional investors, including Capital Group entities, have notably increased their positions in Intel amid ongoing facility expansion and new 6G infrastructure partnerships.
- Intel trades in a strong long-term uptrend with short-term bullish momentum stalling; price is expected to range between $46.00 and $47.00, with immediate resistance at $46.57.
Investment inflows and strategic deals counter lawsuit and selling pressure
A lawsuit was filed on March 12 against Intel's board of directors, alleging the granting of a 10% equity stake in the company to the U.S. government related to concerns over potential social media attacks by the Trump administration. Recent SEC filings showed that Capital Group Private Client Services Inc. and Capital International Inc. CA both reported significant new and increased investments in Intel. The company also reported progress at its Fab 52 production facility in Chandler, Arizona, and expanded its partnership with Ericsson within the areas of 6G infrastructure and Cloud RAN solutions, though price action has remained under broader selling pressure.
Overbought signals rise as momentum weakens near resistance
Momentum indicators show a mixed picture: while Intel trades above all key daily moving averages, suggesting solid trend support, the Ichimoku Kijun at $46.57 acts as immediate resistance. Daily technicals reveal neutral momentum from MACD and ADX, but RSI remains at a bullish 55.86, even as Stoch RSI (100.00), CCI (147.40), and BBP (2.93) all indicate potential overbought conditions and buyer dominance. With price near the daily low inside a narrow $46.12 – $47.23 channel and no significant gap from the previous session, overall volatility is low, and recent selling pressure prevails. The divergence between higher timeframe bullish momentum and short-term exhaustion signals calls for caution as upward momentum loses steam.
Breakout risk builds as momentum wavers within tight trading band
In the next five trading days, Intel is expected to fluctuate within a volatility band of $46.00 to $47.00. The probability of upward movement remains high, exceeding 80%, but momentum must stabilize for sideways action within this range to hold. A clear move above $46.57 would trigger a bullish breakout and open the way for further gains, while a dip below $46.00 would indicate that short-term selling pressure is starting to dominate.
Last time, analysts noted that Intel Corporation advanced sharply, with the stock trading well above its key short-, medium-, and long-term moving averages, indicating strong bullish momentum supported by positive sentiment from investments, new product launches, and strategic partnerships. However, while immediate support is seen near $46.57 and resistance remains just overhead, mixed momentum indicators—including overbought oscillators and a bearish MACD—signal caution as the rally shows signs of potential exhaustion.


-
 Afghanistan
-
 Albania
-
 Algeria
-
 Angola
-
 Argentina
-
 Armenia
-
 Australia
-
 Austria
-
 Azerbaijan
-
 Bahamas
-
 Bahrain
-
 Bangladesh
-
 Belarus
-
 Belgium
-
 Bolivia
-
 Botswana
-
 Brazil
-
 Brunei
-
 Bulgaria
-
 Cambodia
-
 Cameroon
-
 Canada
-
 Chile
Chile
-
 China
China
-
 Colombia
-
 Congo
Congo
-
 Costa Rica
-
 Cote d'Ivoire
-
 Croatia
-
 Cuba
Cuba
-
 Cyprus
-
 Czechia
-
 DR Congo
-
 Denmark
-
 Dominican Republic
-
 Ecuador
-
 Egypt
Egypt
-
 El Salvador
-
 Estonia
-
 Eswatini
-
 Ethiopia
-
 Finland
-
 France
-
 Georgia
-
 Germany
-
 Ghana
Ghana
-
 Greece
-
 Haiti
Haiti
-
 Hong Kong
-
 Hungary
-
 India
India
-
 Indonesia
-
 Iran, Islamic republic
-
 Iraq
Iraq
-
 Ireland
-
 Israel
-
 Italy
Italy
-
 Jamaica
-
 Japan
Japan
-
 Jordan
-
 Kazakhstan
-
 Kenya
Kenya
-
 Korea
Korea
-
 Kuwait
-
 Kyrgyzstan
-
 Laos
Laos
-
 Latvia
-
 Lebanon
-
 Lesotho
-
 Libya
Libya
-
 Lithuania
-
 Luxembourg
-
 Madagascar
-
 Malaysia
-
 Malta
Malta
-
 Mauritius
-
 Mexico
-
 Moldova
-
 Mongolia
-
 Montenegro
-
 Morocco
-
 Mozambique
-
 Myanmar
-
 Namibia
-
 Nepal
Nepal
-
 Netherlands
-
 New Zealand
-
 Nigeria
-
 North Macedonia
-
 Norway
-
 Oman
Oman
-
 Pakistan
-
 Palestine
-
 Panama
-
 Papua New Guinea
-
 Paraguay
-
 Peru
Peru
-
 Philippines
-
 Poland
-
 Portugal
-
 Puerto Rico
-
 Qatar
Qatar
-
 Reunion
-
 Romania
-
 Rwanda
-
 Saudi Arabia
-
 Serbia
-
 Singapore
-
 Slovakia
-
 Slovenia
-
 Somalia
-
 South Africa
-
 Spain
Spain
-
 Sri Lanka
-
 Sweden
-
 Switzerland
-
 Syria
Syria
-
 Taiwan
-
 Tajikistan
-
 Tanzania
-
 Thailand
-
 Trinidad and Tobago
-
 Tunisia
-
 Turkey
-
 UAE
UAE
-
 Uganda
-
 Ukraine
-
 United Kingdom
-
United States
-
 Uruguay
-
 Uzbekistan
-
 Venezuela
-
 Vietnam
-
 Yemen
Yemen
-
 Zambia
-
 Zimbabwe
- Forex
- Crypto
