
Apple stock slides after new blanket tariffs imposed under Trade Act of 1974

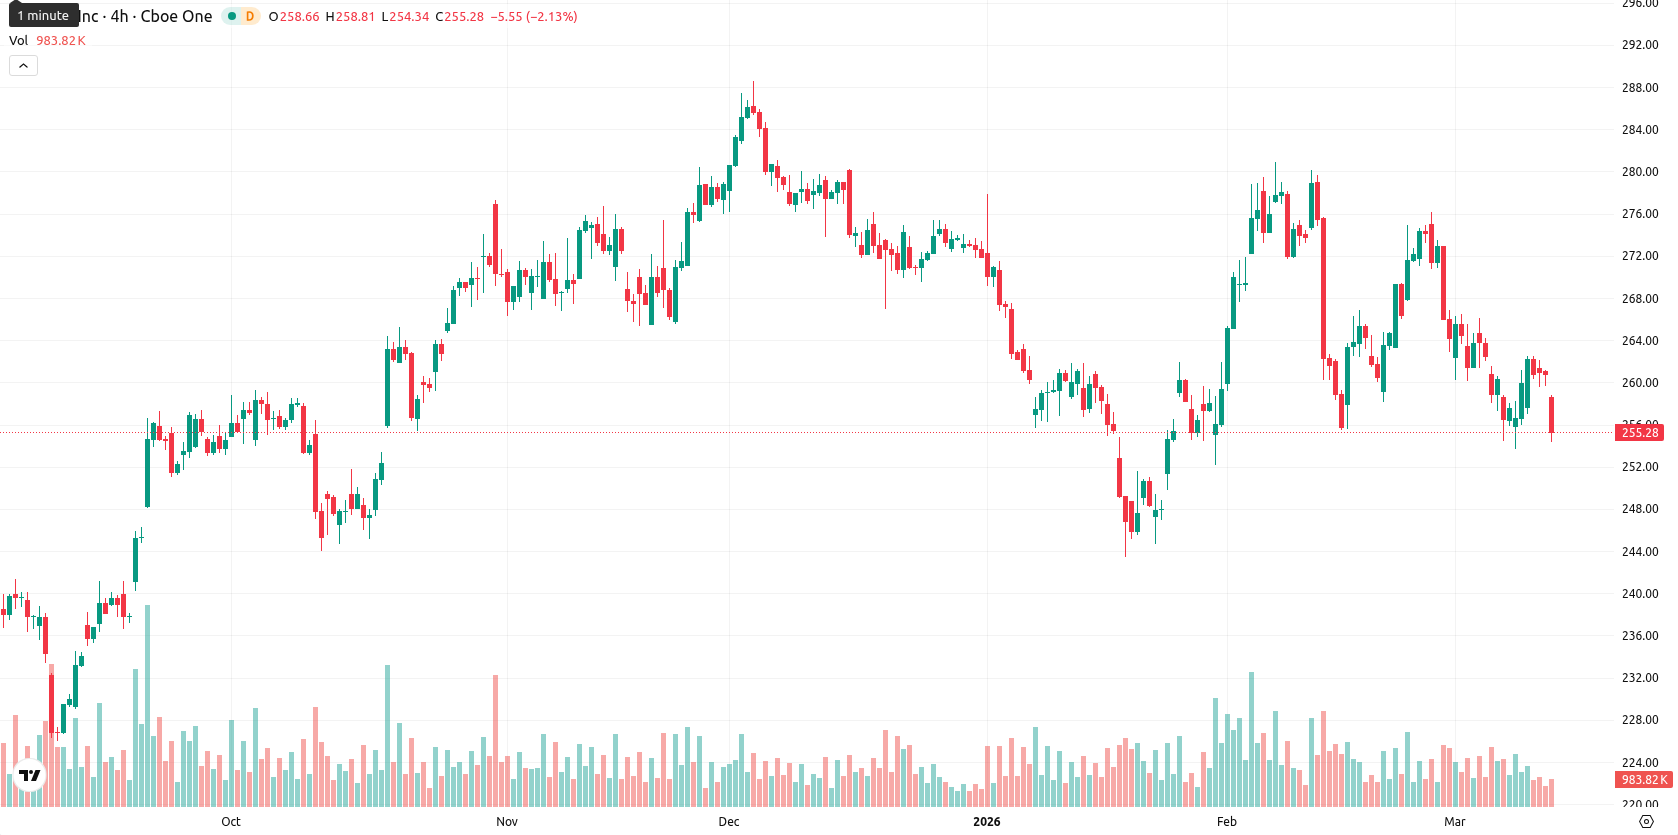
Apple Inc. (AAPL) is trading at $254.65, below the SMA-20 at $264.30 and SMA-50 at $263.53, but remains above the long-term SMA-200 at $245.03. This configuration highlights short- and medium-term selling pressure, though long-term support persists, with Ichimoku Kijun at $267.28 acting as immediate resistance.
Highlights
- The Supreme Court invalidated Trump-era tariffs, prompting the administration to impose immediate 10% blanket tariffs on key U.S. trading partners.
- Apple faces heightened risks to its supply chain, input costs, and market access due to new trade measures targeting major manufacturing countries.
- AAPL trades near $254.65 with short-term bearish momentum, projected to move sideways between $252 and $258.50 barring a break below or above these levels.
Tariff escalation risks as Supreme Court ruling drives new investigations
On March 11, 2026, the U.S. Supreme Court ruled that President Trump's prior use of the International Emergency Economic Powers Act to impose tariffs was unauthorized, resulting in the invalidation of current country-specific tariffs. In response, the administration implemented new trade investigations under Section 122 and Section 301 of the Trade Act of 1974 targeting major U.S. trading partners, immediately imposing a 10% blanket tariff and paving the way for further increases. These measures present direct risks to Apple's supply chain, cost structure, and market access due to the company's dependence on manufacturing and sourcing from the affected countries. Ongoing legal uncertainty and litigation over these tariffs add further regulatory risk for Apple’s operations and product pricing.
Seller control as momentum signals align with persistent downside
Momentum on the daily time frame remains weak for AAPL, with MACD signaling a sell and ADX at 12.86, indicating a lack of strong direction. RSI is at 45.43 and CCI stands at –54.95, both pointing to selling or oversold levels, while Stoch RSI is neutral but with oversold intraday signals; BBP at –0.69 confirms active seller dominance. Awesome Oscillator supports the bearish picture, with the price dropping $6.16 or 2.36% on the day, opening with a modest gap down and trading near today’s low. Intraday volatility is moderate, with continued downward pressure after the open and no indications of upward recovery, as all key momentum and oscillator signals align to the downside without significant divergence.
Limited rebound odds as volatility range favors range-bound trade
For the next five trading days, AAPL is expected to fluctuate in a range of $252.00 to $258.50, representing a typical volatility band relative to current levels. The probability of a price increase remains very low (less than 20%) according to daily and weekly indicators, implying a greater likelihood of a move lower. The baseline scenario anticipates sideways movement within this range. Upside would require a breakout above $258.50 and resistance near $267, while a breakdown below $252.00 could open the path toward long-term support at $245.00.
Last time, analysts noted that Apple shares are trading with ongoing short- and medium-term downside pressure, staying below the 20- and 50-day moving averages but holding above long-term support at the 200-day. Momentum indicators, including MACD and daily oscillators, confirm prevailing bearish sentiment with the stock nearing oversold conditions, while resistance remains firm and the probability of a near-term rebound appears limited.


-
 Afghanistan
-
 Albania
-
 Algeria
-
 Angola
-
 Argentina
-
 Armenia
-
 Australia
-
 Austria
-
 Azerbaijan
-
 Bahamas
-
 Bahrain
-
 Bangladesh
-
 Belarus
-
 Belgium
-
 Bolivia
-
 Botswana
-
 Brazil
-
 Brunei
-
 Bulgaria
-
 Cambodia
-
 Cameroon
-
 Canada
-
 Chile
Chile
-
 China
China
-
 Colombia
-
 Congo
Congo
-
 Costa Rica
-
 Cote d'Ivoire
-
 Croatia
-
 Cuba
Cuba
-
 Cyprus
-
 Czechia
-
 DR Congo
-
 Denmark
-
 Dominican Republic
-
 Ecuador
-
 Egypt
Egypt
-
 El Salvador
-
 Estonia
-
 Eswatini
-
 Ethiopia
-
 Finland
-
 France
-
 Georgia
-
 Germany
-
 Ghana
Ghana
-
 Greece
-
 Haiti
Haiti
-
 Hong Kong
-
 Hungary
-
 India
India
-
 Indonesia
-
 Iran, Islamic republic
-
 Iraq
Iraq
-
 Ireland
-
 Israel
-
 Italy
Italy
-
 Jamaica
-
 Japan
Japan
-
 Jordan
-
 Kazakhstan
-
 Kenya
Kenya
-
 Korea
Korea
-
 Kuwait
-
 Kyrgyzstan
-
 Laos
Laos
-
 Latvia
-
 Lebanon
-
 Lesotho
-
 Libya
Libya
-
 Lithuania
-
 Luxembourg
-
 Madagascar
-
 Malaysia
-
 Malta
Malta
-
 Mauritius
-
 Mexico
-
 Moldova
-
 Mongolia
-
 Montenegro
-
 Morocco
-
 Mozambique
-
 Myanmar
-
 Namibia
-
 Nepal
Nepal
-
 Netherlands
-
 New Zealand
-
 Nigeria
-
 North Macedonia
-
 Norway
-
 Oman
Oman
-
 Pakistan
-
 Palestine
-
 Panama
-
 Papua New Guinea
-
 Paraguay
-
 Peru
Peru
-
 Philippines
-
 Poland
-
 Portugal
-
 Puerto Rico
-
 Qatar
Qatar
-
 Reunion
-
 Romania
-
 Rwanda
-
 Saudi Arabia
-
 Serbia
-
 Singapore
-
 Slovakia
-
 Slovenia
-
 Somalia
-
 South Africa
-
 Spain
Spain
-
 Sri Lanka
-
 Sweden
-
 Switzerland
-
 Syria
Syria
-
 Taiwan
-
 Tajikistan
-
 Tanzania
-
 Thailand
-
 Trinidad and Tobago
-
 Tunisia
-
 Turkey
-
 UAE
UAE
-
 Uganda
-
 Ukraine
-
 United Kingdom
-
United States
-
 Uruguay
-
 Uzbekistan
-
 Venezuela
-
 Vietnam
-
 Yemen
Yemen
-
 Zambia
-
 Zimbabwe
- Forex
- Crypto
