
Banking division milestone fails to lift mood — Robinhood stock drops 3.60%

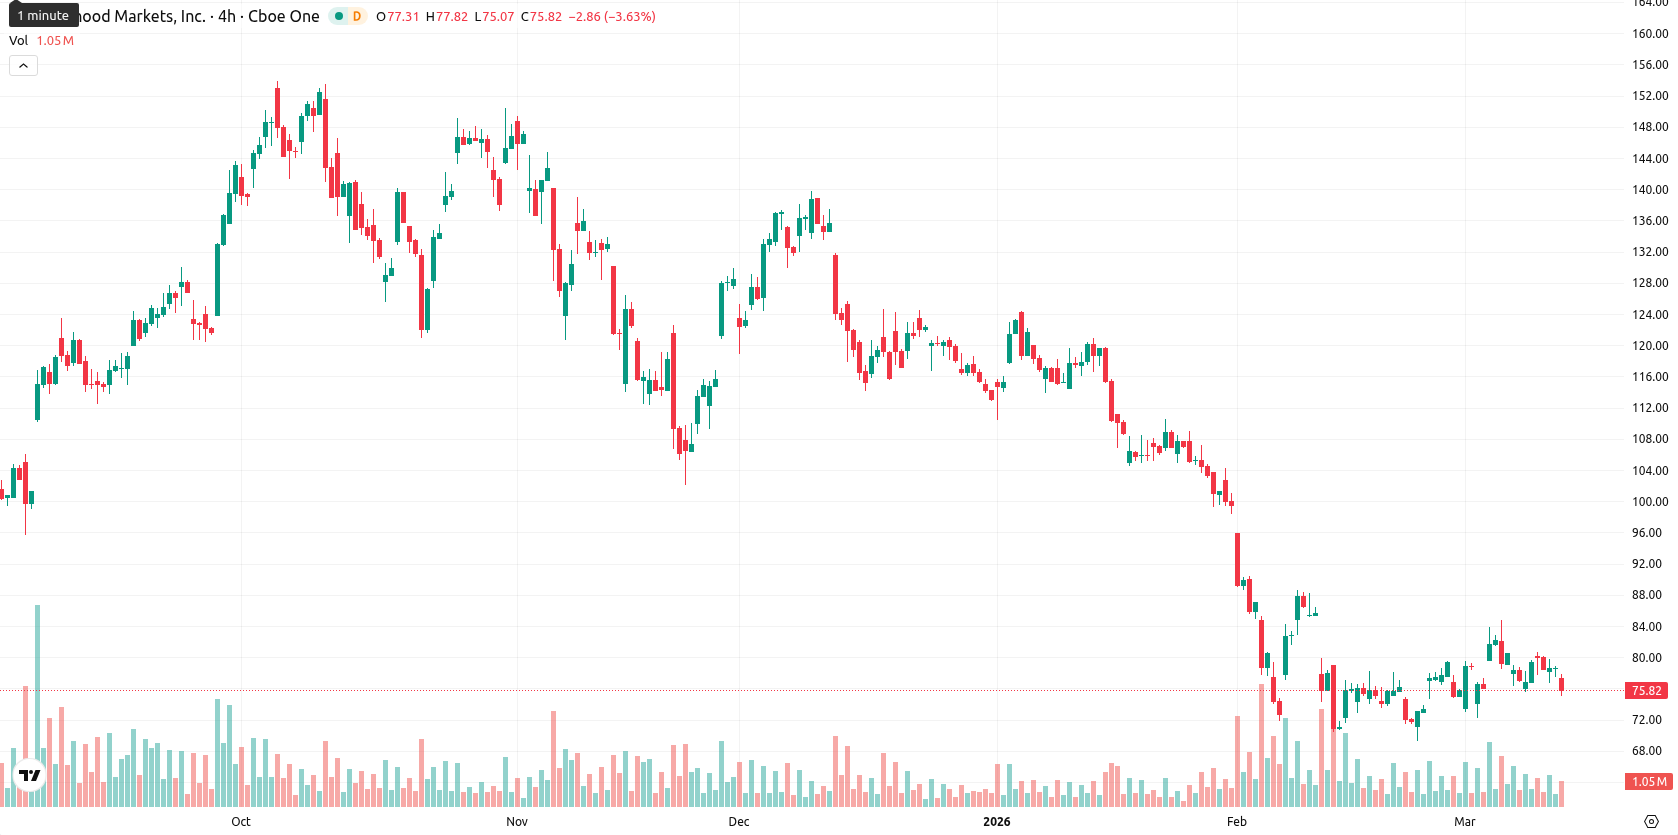
Robinhood Markets Inc (HOOD) is trading at $75.86, positioned below the MA-20 ($76.84), MA-50 ($93.87), and well under the MA-200 ($107.56). This reflects both short- and medium-term selling pressure, a bearish long-term structure, and immediate resistance at the Ichimoku Kijun of $79.79.
Highlights
- Robinhood’s banking unit garnered $1 billion in deposits from 65,000 users within four months of launch.
- The company’s expansion into banking and its Platinum Card aligns with efforts to build a comprehensive financial ecosystem beyond trading.
- HOOD trades under key moving averages, with strong bearish momentum and a forecasted range of $71.00 to $78.00 for the next week.
Banking deposits and card launch drive ecosystem pivot amid price weakness
Robinhood achieved $1 billion in deposits within its banking division, reaching this milestone from 65,000 users in four months after launch. This expansion supports its push toward a broader financial ecosystem and the rollout of its new Platinum Card as part of the company's 'Super App' strategy. The extension into banking services aimed to diversify financial offerings beyond retail trading, though price action has remained under broader selling pressure.
Downside momentum persists as mixed oscillators reflect volatile trading
Momentum indicators on the daily chart remain bearish, with both MACD and ADX signaling strong downside pressure, and RSI at 44.54 maintains a sell outlook. The Stoch RSI indicates overbought conditions, while CCI shows modest buying pressure, giving mixed oscillator signals. BBP is firmly overbought (0.99), but price action does not confirm this, suggesting sellers are dominant on an intraday basis. The Awesome Oscillator is neutral, and following a minor gap down at the open, HOOD has dropped 3.60% to the lower end of today's range ($75.25 – $77.66), reflecting high volatility and sustained pressure.
Sideways baseline as bullish reversal hinges on resistance breakout
For the next five trading days, the expected volatility band relative to current levels is $71.00 to $78.00. There is a very low probability (less than 20%) of a price increase, while a decrease appears more likely. The baseline scenario for HOOD is a sideways movement between adjusted support and resistance. A break above $79.79 (Kijun) is required for a bullish reversal, while a bearish move could test support near the $71.00 zone.
Previously it was reported that Robinhood Markets Inc. is consolidating beneath its key moving averages, with persistent selling pressure indicated across short, medium, and long-term technicals. Momentum signals remain broadly bearish as MACD and AO align to the downside, the RSI sits in neutral territory, and the nearest dynamic resistance is observed at $79.79.


Latest Robinhood News


-
 Afghanistan
-
 Albania
-
 Algeria
-
 Angola
-
 Argentina
-
 Armenia
-
 Australia
-
 Austria
-
 Azerbaijan
-
 Bahamas
-
 Bahrain
-
 Bangladesh
-
 Belarus
-
 Belgium
-
 Bolivia
-
 Botswana
-
 Brazil
-
 Brunei
-
 Bulgaria
-
 Cambodia
-
 Cameroon
-
 Canada
-
 Chile
Chile
-
 China
China
-
 Colombia
-
 Congo
Congo
-
 Costa Rica
-
 Cote d'Ivoire
-
 Croatia
-
 Cuba
Cuba
-
 Cyprus
-
 Czechia
-
 DR Congo
-
 Denmark
-
 Dominican Republic
-
 Ecuador
-
 Egypt
Egypt
-
 El Salvador
-
 Estonia
-
 Eswatini
-
 Ethiopia
-
 Finland
-
 France
-
 Georgia
-
 Germany
-
 Ghana
Ghana
-
 Greece
-
 Haiti
Haiti
-
 Hong Kong
-
 Hungary
-
 India
India
-
 Indonesia
-
 Iran, Islamic republic
-
 Iraq
Iraq
-
 Ireland
-
 Israel
-
 Italy
Italy
-
 Jamaica
-
 Japan
Japan
-
 Jordan
-
 Kazakhstan
-
 Kenya
Kenya
-
 Korea
Korea
-
 Kuwait
-
 Kyrgyzstan
-
 Laos
Laos
-
 Latvia
-
 Lebanon
-
 Lesotho
-
 Libya
Libya
-
 Lithuania
-
 Luxembourg
-
 Madagascar
-
 Malaysia
-
 Malta
Malta
-
 Mauritius
-
 Mexico
-
 Moldova
-
 Mongolia
-
 Montenegro
-
 Morocco
-
 Mozambique
-
 Myanmar
-
 Namibia
-
 Nepal
Nepal
-
 Netherlands
-
 New Zealand
-
 Nigeria
-
 North Macedonia
-
 Norway
-
 Oman
Oman
-
 Pakistan
-
 Palestine
-
 Panama
-
 Papua New Guinea
-
 Paraguay
-
 Peru
Peru
-
 Philippines
-
 Poland
-
 Portugal
-
 Puerto Rico
-
 Qatar
Qatar
-
 Reunion
-
 Romania
-
 Rwanda
-
 Saudi Arabia
-
 Serbia
-
 Singapore
-
 Slovakia
-
 Slovenia
-
 Somalia
-
 South Africa
-
 Spain
Spain
-
 Sri Lanka
-
 Sweden
-
 Switzerland
-
 Syria
Syria
-
 Taiwan
-
 Tajikistan
-
 Tanzania
-
 Thailand
-
 Trinidad and Tobago
-
 Tunisia
-
 Turkey
-
 UAE
UAE
-
 Uganda
-
 Ukraine
-
 United Kingdom
-
United States
-
 Uruguay
-
 Uzbekistan
-
 Venezuela
-
 Vietnam
-
 Yemen
Yemen
-
 Zambia
-
 Zimbabwe
- Forex
- Crypto
