
+3.06% for Vodafone stock — Buyback activity and strong weekly outlook boost sentiment

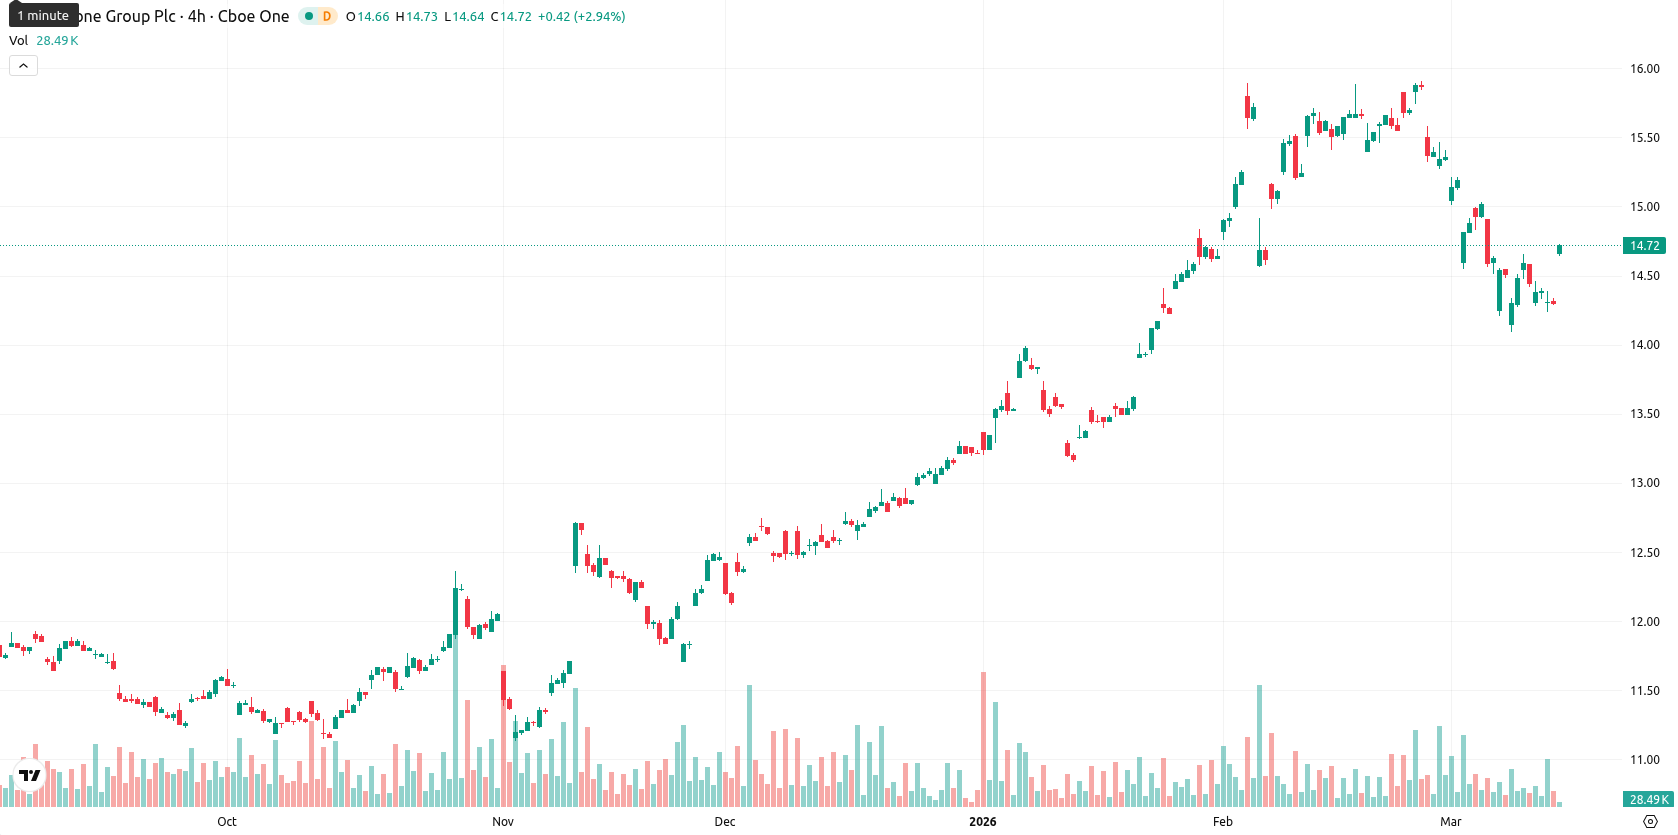
Vodafone Group Plc (VOD) is trading at $111.10 with a daily gain of 3.06%. The stock is below the SMA-20 ($112.69), above the SMA-50 ($108.27), and well above the SMA-200 ($91.73), indicating ongoing short-term selling, medium-term support, and a robust long-term uptrend.
Highlights
- Vodafone repurchased 2,000,000 shares at an average price of 107.14p each, expanding treasury holdings to 1.76 billion shares.
- The buyback forms part of Vodafone’s ongoing capital return programme, leaving 23.1 billion shares in circulation excluding treasury stock.
- Technical signals show oversold conditions and neutral momentum, with a high probability of short-term stabilization within the $105–$113 range.
Treasury holdings rise as Vodafone accelerates ongoing buybacks
Vodafone has repurchased 2,000,000 ordinary shares through Goldman Sachs on March 11, 2026 on the London Stock Exchange, with an average price of 107.14 pence per share. These shares will be held in treasury, raising Vodafone’s treasury holdings to 1,759,669,902 shares, while 23,118,290,855 shares remain in issue excluding treasury stock. The buyback is part of an ongoing repurchase programme and reflects continued corporate action by Vodafone.
Mixed momentum and weak trend strength amid technical resistance
Technically, VOD remains below the D1 SMA-20 but above both the SMA-50 and significantly above the SMA-200, suggesting that while short-term pressure is present, the medium and long-term trend structures are supportive. The Ichimoku Kijun stands at $112.59, acting as immediate resistance. Daily momentum is mixed: the MACD is neutral, ADX reflects weak trend strength with a sell tilt, RSI is at 41.35, and CCI as well as Stoch RSI are deeply oversold, highlighting the potential for a short-term bounce. BBP is negative and oversold, indicating sellers still dominate, and the Awesome Oscillator also points to selling. After an initial lower open and a sharp rebound to session highs, moderate-to-high volatility has prevailed, with buyers pushing back within today’s range. Nonetheless, oscillators and momentum readings show uncertainty around near-term follow-through.
Sideways range favored as bullish weekly signals reduce downside risk
Looking ahead, the anticipated price range for the next five trading days sits within the $105.20 to $113.08 volatility band relative to current levels. Weekly indicators (RSI, ADX, MACD, SMA-50) are all bullish, suggesting an over 80% likelihood of stabilization or upside, with a meaningful decline less probable. The baseline scenario is continued sideways movement in the $105–$113 range. A break above resistance at $112.59 could lead to further gains, while a move below $105 would open the door to deeper downside, though current trends make this outcome unlikely.
Last time, analysts noted that Vodafone Group plc is exhibiting short-term bearish pressure as it trades below its 20-day and just under its 50-day moving averages, while remaining comfortably above the 200-day average. Despite buy signals from MACD and ADX amid oversold oscillator readings and dynamic resistance near the Ichimoku Kijun, the stock’s momentum is diverging, with seller dominance prevailing in the near term.


Latest Vodafone News


-
 Afghanistan
-
 Albania
-
 Algeria
-
 Angola
-
 Argentina
-
 Armenia
-
 Australia
-
 Austria
-
 Azerbaijan
-
 Bahamas
-
 Bahrain
-
 Bangladesh
-
 Belarus
-
 Belgium
-
 Bolivia
-
 Botswana
-
 Brazil
-
 Brunei
-
 Bulgaria
-
 Cambodia
-
 Cameroon
-
 Canada
-
 Chile
Chile
-
 China
China
-
 Colombia
-
 Congo
Congo
-
 Costa Rica
-
 Cote d'Ivoire
-
 Croatia
-
 Cuba
Cuba
-
 Cyprus
-
 Czechia
-
 DR Congo
-
 Denmark
-
 Dominican Republic
-
 Ecuador
-
 Egypt
Egypt
-
 El Salvador
-
 Estonia
-
 Eswatini
-
 Ethiopia
-
 Finland
-
 France
-
 Georgia
-
 Germany
-
 Ghana
Ghana
-
 Greece
-
 Haiti
Haiti
-
 Hong Kong
-
 Hungary
-
 India
India
-
 Indonesia
-
 Iran, Islamic republic
-
 Iraq
Iraq
-
 Ireland
-
 Israel
-
 Italy
Italy
-
 Jamaica
-
 Japan
Japan
-
 Jordan
-
 Kazakhstan
-
 Kenya
Kenya
-
 Korea
Korea
-
 Kuwait
-
 Kyrgyzstan
-
 Laos
Laos
-
 Latvia
-
 Lebanon
-
 Lesotho
-
 Libya
Libya
-
 Lithuania
-
 Luxembourg
-
 Madagascar
-
 Malaysia
-
 Malta
Malta
-
 Mauritius
-
 Mexico
-
 Moldova
-
 Mongolia
-
 Montenegro
-
 Morocco
-
 Mozambique
-
 Myanmar
-
 Namibia
-
 Nepal
Nepal
-
 Netherlands
-
 New Zealand
-
 Nigeria
-
 North Macedonia
-
 Norway
-
 Oman
Oman
-
 Pakistan
-
 Palestine
-
 Panama
-
 Papua New Guinea
-
 Paraguay
-
 Peru
Peru
-
 Philippines
-
 Poland
-
 Portugal
-
 Puerto Rico
-
 Qatar
Qatar
-
 Reunion
-
 Romania
-
 Rwanda
-
 Saudi Arabia
-
 Serbia
-
 Singapore
-
 Slovakia
-
 Slovenia
-
 Somalia
-
 South Africa
-
 Spain
Spain
-
 Sri Lanka
-
 Sweden
-
 Switzerland
-
 Syria
Syria
-
 Taiwan
-
 Tajikistan
-
 Tanzania
-
 Thailand
-
 Trinidad and Tobago
-
 Tunisia
-
 Turkey
-
 UAE
UAE
-
 Uganda
-
 Ukraine
-
 United Kingdom
-
United States
-
 Uruguay
-
 Uzbekistan
-
 Venezuela
-
 Vietnam
-
 Yemen
Yemen
-
 Zambia
-
 Zimbabwe
- Forex
- Crypto
