
Sundial Growers stock: Persistent sell signals drive continued declines toward $1.38 support

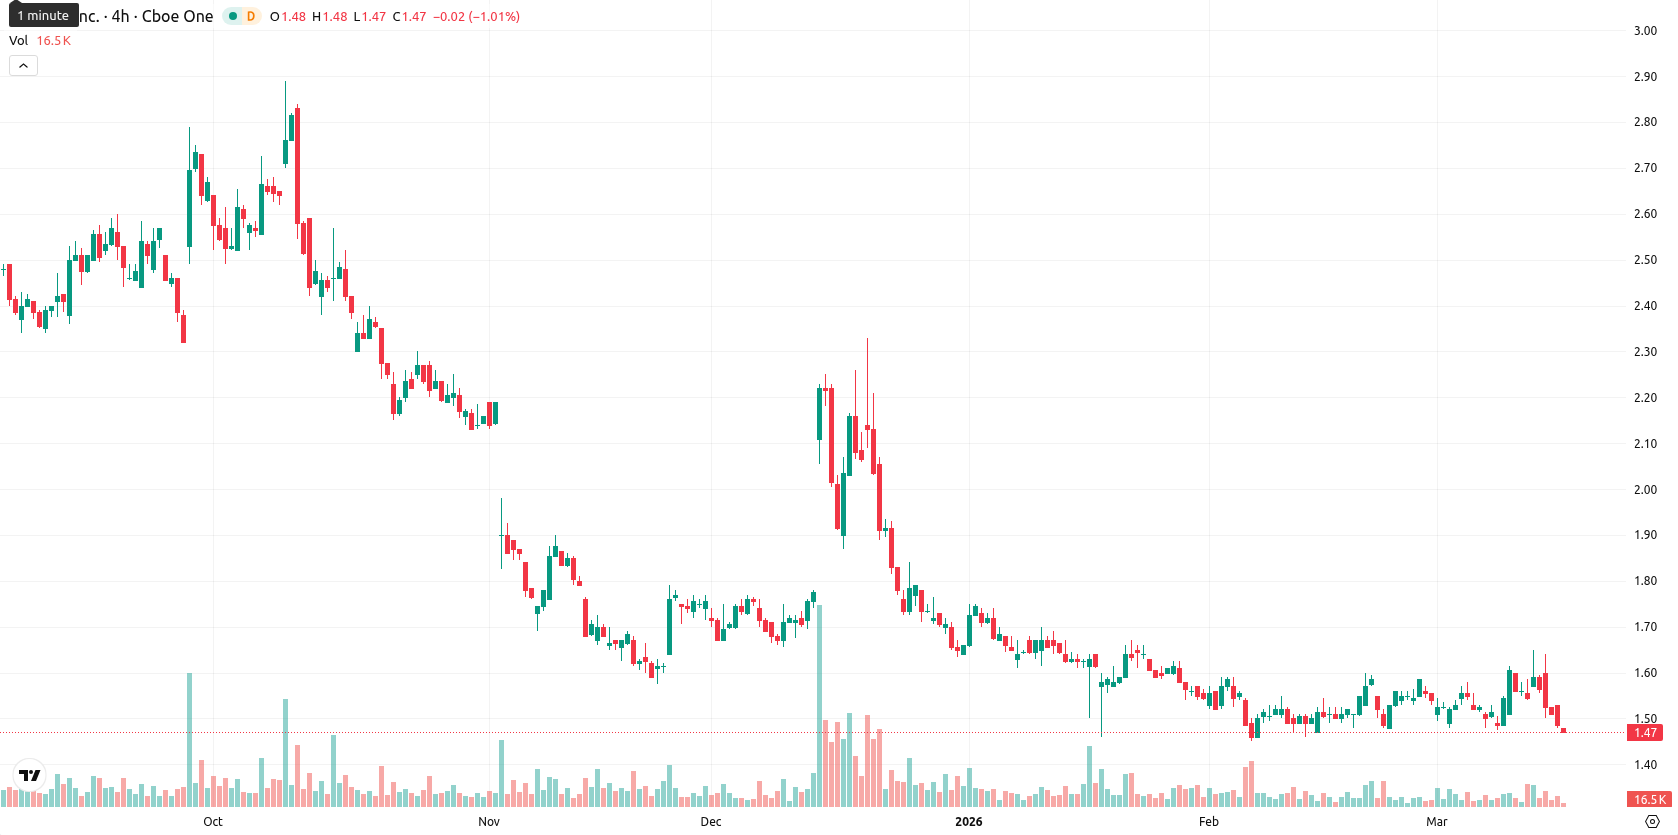
SNDL Inc. (SNDL) is trading at $1.44, down 5.28% on the day. The price remains below the MA-20 ($1.54), MA-50 ($1.57), and MA-200 ($1.82), highlighting sustained downward pressure in all timeframes.
Highlights
- SNDL remains under consistent selling pressure, trading below all key moving averages and failing to overcome immediate resistance levels.
- Momentum indicators signal a bearish trend with persistent negative signals, limited short-term buyer activity, and strong control by sellers.
- The stock is expected to fluctuate between $1.38 and $1.52 over the next five days, with downside movement much more likely unless price reclaims $1.55.
Negative momentum and weak trend as technical resistance caps SNDL
Momentum signals continue to point negative for SNDL, with the Ichimoku Kijun level on D1 at $1.55 acting as immediate resistance. The MACD registers a strong sell signal and the ADX (14.51) indicates a weak, non-trending market. RSI at 45.32 and CCI at 39.84 show mild downward momentum, while Stoch RSI remains deeply oversold. BBP at 0.09 signals light buyer activity on D1, but sellers dominate all intraday frames, and the Awesome Oscillator remains neutral.
Sideways outlook dominates as bearish signals limit upside probability
Over the next five trading days, SNDL is expected to fluctuate within a volatility band relative to current levels, ranging from $1.38 to $1.52. The probability of a move higher is less than 20%, as multiple weekly sell signals persist from the MA-50, RSI, ADX, and MACD indicators. The baseline scenario is sideways movement between $1.38 and $1.52. An advance above $1.55 would be required to trigger a bullish case, while a close below $1.38 could signal further selling.
Previously it was reported that Sundial Growers was experiencing persistent selling pressure with weak momentum indicators across all timeframes. The current analysis not only reinforces this bearish outlook but also highlights $1.38 as a key downside level to monitor for an acceleration of losses in the coming sessions.


-
 Afghanistan
-
 Albania
-
 Algeria
-
 Angola
-
 Argentina
-
 Armenia
-
 Australia
-
 Austria
-
 Azerbaijan
-
 Bahamas
-
 Bahrain
-
 Bangladesh
-
 Belarus
-
 Belgium
-
 Bolivia
-
 Botswana
-
 Brazil
-
 Brunei
-
 Bulgaria
-
 Cambodia
-
 Cameroon
-
 Canada
-
 Chile
Chile
-
 China
China
-
 Colombia
-
 Congo
Congo
-
 Costa Rica
-
 Cote d'Ivoire
-
 Croatia
-
 Cuba
Cuba
-
 Cyprus
-
 Czechia
-
 DR Congo
-
 Denmark
-
 Dominican Republic
-
 Ecuador
-
 Egypt
Egypt
-
 El Salvador
-
 Estonia
-
 Eswatini
-
 Ethiopia
-
 Finland
-
 France
-
 Georgia
-
 Germany
-
 Ghana
Ghana
-
 Greece
-
 Haiti
Haiti
-
 Hong Kong
-
 Hungary
-
 India
India
-
 Indonesia
-
 Iran, Islamic republic
-
 Iraq
Iraq
-
 Ireland
-
 Israel
-
 Italy
Italy
-
 Jamaica
-
 Japan
Japan
-
 Jordan
-
 Kazakhstan
-
 Kenya
Kenya
-
 Korea
Korea
-
 Kuwait
-
 Kyrgyzstan
-
 Laos
Laos
-
 Latvia
-
 Lebanon
-
 Lesotho
-
 Libya
Libya
-
 Lithuania
-
 Luxembourg
-
 Madagascar
-
 Malaysia
-
 Malta
Malta
-
 Mauritius
-
 Mexico
-
 Moldova
-
 Mongolia
-
 Montenegro
-
 Morocco
-
 Mozambique
-
 Myanmar
-
 Namibia
-
 Nepal
Nepal
-
 Netherlands
-
 New Zealand
-
 Nigeria
-
 North Macedonia
-
 Norway
-
 Oman
Oman
-
 Pakistan
-
 Palestine
-
 Panama
-
 Papua New Guinea
-
 Paraguay
-
 Peru
Peru
-
 Philippines
-
 Poland
-
 Portugal
-
 Puerto Rico
-
 Qatar
Qatar
-
 Reunion
-
 Romania
-
 Rwanda
-
 Saudi Arabia
-
 Serbia
-
 Singapore
-
 Slovakia
-
 Slovenia
-
 Somalia
-
 South Africa
-
 Spain
Spain
-
 Sri Lanka
-
 Sweden
-
 Switzerland
-
 Syria
Syria
-
 Taiwan
-
 Tajikistan
-
 Tanzania
-
 Thailand
-
 Trinidad and Tobago
-
 Tunisia
-
 Turkey
-
 UAE
UAE
-
 Uganda
-
 Ukraine
-
 United Kingdom
-
United States
-
 Uruguay
-
 Uzbekistan
-
 Venezuela
-
 Vietnam
-
 Yemen
Yemen
-
 Zambia
-
 Zimbabwe
- Forex
- Crypto
