
Intuit stock price forecast: Buyback program and Q2 earnings drive INTU higher

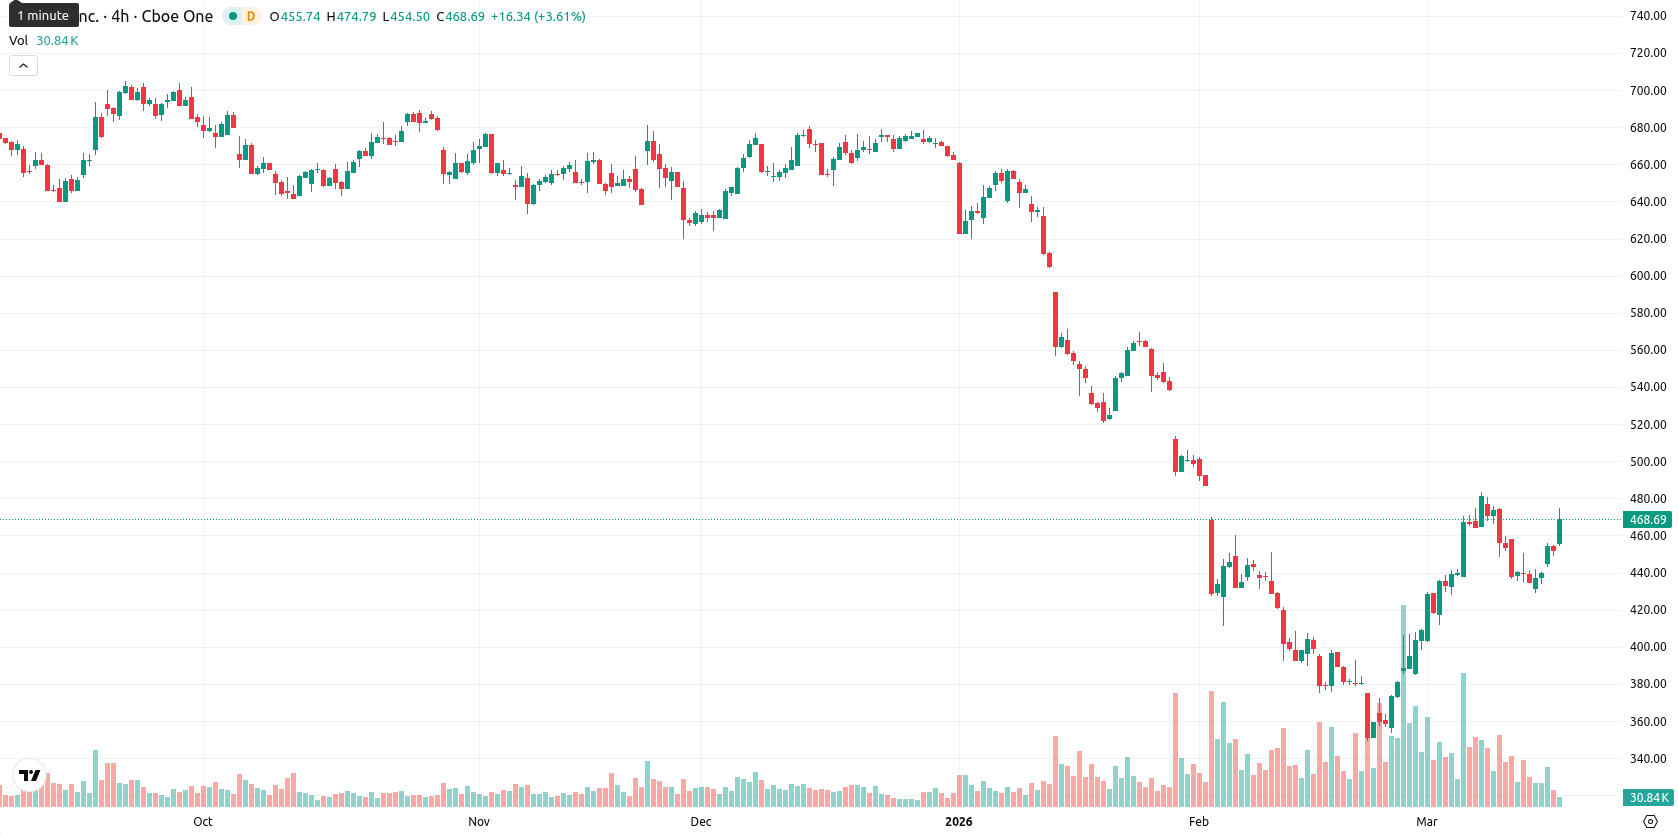
Intuit Inc. (INTU) is trading at $467.52, gaining 3.35% on the day. The price stands above the SMA-20 ($418.46), but remains below the SMA-50 ($485.04) and the SMA-200 ($647.50), indicating short-term upward momentum with stronger medium- and long-term resistance.
Highlights
- Intuit canceled all executive pre-scheduled stock sale plans due to a perceived undervaluation and announced a $3.5 billion accelerated buyback through fiscal 2026.
- Q2 2026 revenue reached $4.7 billion, beating operating margin and EPS expectations, with a declared quarterly dividend of $1.20 per share.
- Technical momentum is mixed, with strong short-term buyers but dominant medium- and long-term bearish signals, confining price action to a likely $445–$490 range short term.
Buybacks accelerate as leadership ends 10b5-1 sales on valuation gap
Intuit has terminated all outstanding pre-scheduled stock sale plans under Rule 10b5-1 by its founder and executive leadership team, citing a significant disconnect between current price and fundamental value. The company announced an accelerated share repurchase program authorizing up to $3.5 billion in buybacks through fiscal year 2026, expected to double the repurchase pace from the previous year. Intuit reported Q2 2026 revenue of $4.7 billion, surpassing operating margin and earnings per share expectations, and declared a quarterly dividend of $1.20 per share for April 17, 2026.
Mixed momentum signals as oscillators diverge from weak trend readings
INTU recently traded at $467.52, above the SMA-20 ($418.46), but below both the SMA-50 ($485.04) and well under the SMA-200 ($647.50). This structure favors shorter-term upward momentum but highlights medium- and long-term resistance, while the Ichimoku Kijun level at $416.10 now acts as immediate support. Momentum signals are mixed: the D1 MACD remains in "Strong Sell" territory and the D1 ADX signals continued seller pressure, yet RSI, Stoch RSI, and CCI are all in "Buy" zones, with Stoch RSI and BBP showing overbought conditions and positive BBP indicating strong buyer dominance intraday. The AO is neutral, not confirming the uptrend, and there is a notable gap up from yesterday’s close ($452.35) to today’s open ($460.25); price is now in the upper third of today’s range ($458.71 to $474.36), marking high intraday volatility and enduring strength toward session highs. The divergence between rising oscillators and weak trend-following signals (MACD, ADX) suggests near-term upside is energetic but potentially overextended versus momentum conditions.
Downside risk grows as weekly signals outweigh daily oscillator strength
The expected range for the next 5 trading days is approximately $445 to $490, centered around the current price and reflecting recent realized moves. In the short term, the probability of additional gains is very low (less than 20%), with a decline more likely due to persistent "Sell" signals across W1 trend and momentum indicators and only D1 oscillators showing strength. The baseline scenario sees consolidation within this $445 – $490 volatility band relative to current levels. A bullish scenario would require a close above $490 to confirm further upside, while a break below $445 opens room for a deeper pullback toward lower weekly supports.
Earlier, analysts noted that Intuit was exhibiting short-term bullish momentum but faced persistent medium- and long-term resistance, warranting a cautious near-term outlook. Current market signals reinforce this view, with mixed momentum and trend indicators suggesting that traders should watch for a decisive move outside the $445–$490 range to confirm the next directional shift.


-
 Afghanistan
-
 Albania
-
 Algeria
-
 Angola
-
 Argentina
-
 Armenia
-
 Australia
-
 Austria
-
 Azerbaijan
-
 Bahamas
-
 Bahrain
-
 Bangladesh
-
 Belarus
-
 Belgium
-
 Bolivia
-
 Botswana
-
 Brazil
-
 Brunei
-
 Bulgaria
-
 Cambodia
-
 Cameroon
-
 Canada
-
 Chile
Chile
-
 China
China
-
 Colombia
-
 Congo
Congo
-
 Costa Rica
-
 Cote d'Ivoire
-
 Croatia
-
 Cuba
Cuba
-
 Cyprus
-
 Czechia
-
 DR Congo
-
 Denmark
-
 Dominican Republic
-
 Ecuador
-
 Egypt
Egypt
-
 El Salvador
-
 Estonia
-
 Eswatini
-
 Ethiopia
-
 Finland
-
 France
-
 Georgia
-
 Germany
-
 Ghana
Ghana
-
 Greece
-
 Haiti
Haiti
-
 Hong Kong
-
 Hungary
-
 India
India
-
 Indonesia
-
 Iran, Islamic republic
-
 Iraq
Iraq
-
 Ireland
-
 Israel
-
 Italy
Italy
-
 Jamaica
-
 Japan
Japan
-
 Jordan
-
 Kazakhstan
-
 Kenya
Kenya
-
 Korea
Korea
-
 Kuwait
-
 Kyrgyzstan
-
 Laos
Laos
-
 Latvia
-
 Lebanon
-
 Lesotho
-
 Libya
Libya
-
 Lithuania
-
 Luxembourg
-
 Madagascar
-
 Malaysia
-
 Malta
Malta
-
 Mauritius
-
 Mexico
-
 Moldova
-
 Mongolia
-
 Montenegro
-
 Morocco
-
 Mozambique
-
 Myanmar
-
 Namibia
-
 Nepal
Nepal
-
 Netherlands
-
 New Zealand
-
 Nigeria
-
 North Macedonia
-
 Norway
-
 Oman
Oman
-
 Pakistan
-
 Palestine
-
 Panama
-
 Papua New Guinea
-
 Paraguay
-
 Peru
Peru
-
 Philippines
-
 Poland
-
 Portugal
-
 Puerto Rico
-
 Qatar
Qatar
-
 Reunion
-
 Romania
-
 Rwanda
-
 Saudi Arabia
-
 Serbia
-
 Singapore
-
 Slovakia
-
 Slovenia
-
 Somalia
-
 South Africa
-
 Spain
Spain
-
 Sri Lanka
-
 Sweden
-
 Switzerland
-
 Syria
Syria
-
 Taiwan
-
 Tajikistan
-
 Tanzania
-
 Thailand
-
 Trinidad and Tobago
-
 Tunisia
-
 Turkey
-
 UAE
UAE
-
 Uganda
-
 Ukraine
-
 United Kingdom
-
United States
-
 Uruguay
-
 Uzbekistan
-
 Venezuela
-
 Vietnam
-
 Yemen
Yemen
-
 Zambia
-
 Zimbabwe
- Forex
- Crypto
