
Apple stock: Bearish momentum and oversold levels limit upside despite modest session gain

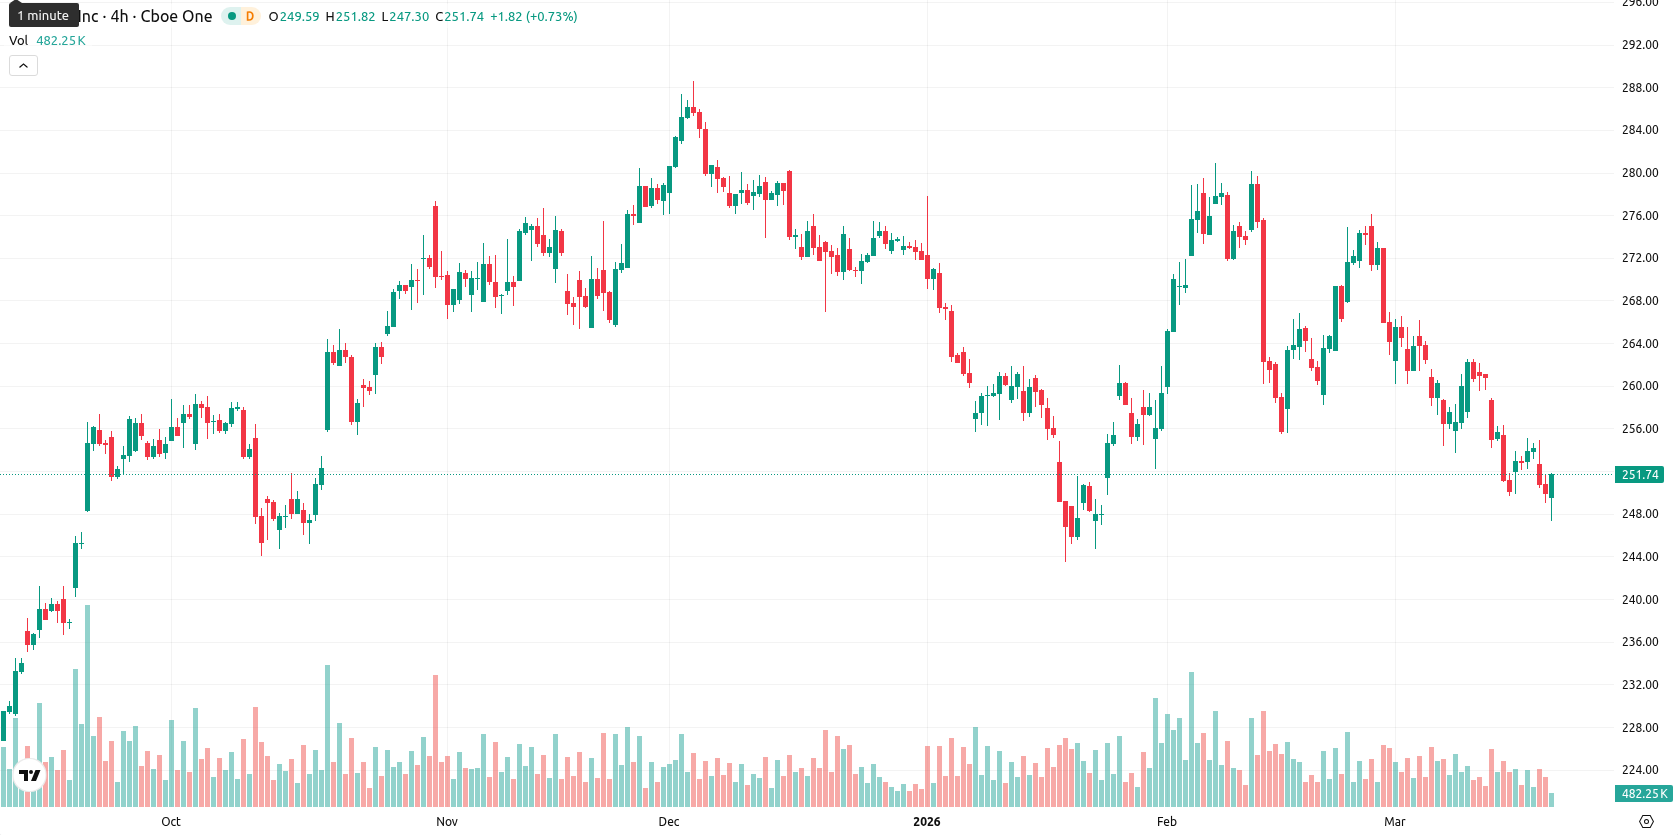
Apple Inc. (AAPL) is trading at $250.74, well below both the SMA-20 ($261.39) and SMA-50 ($261.65), highlighting prevailing short- and medium-term downward pressure; however, it remains above the SMA-200 ($246.36), which provides some underlying longer-term support. The Ichimoku Kijun level is $264.65, acting as immediate resistance above the current price.
Highlights
- Apple reported record $25.5 billion quarterly revenue in Greater China, fueled by strong iPhone 17 demand.
- CEO Tim Cook reaffirmed leadership stability and ongoing share buybacks, maintaining Apple's capital return strategy and a 0.42% yield.
- AAPL trades in a short- and medium-term downtrend with weak momentum, expected to range between $242.00 and $258.00 as technicals remain bearish but oversold.
Leadership stability and China sales boost sentiment amid buybacks
Apple CEO Tim Cook has dismissed retirement rumors, reaffirming leadership stability. The company maintains ongoing capital returns through share buybacks and a reported yield of 0.42%. Tim Cook recently appeared at an Apple store event in Chengdu, China, marking Apple's 50th anniversary, and the company reported record quarterly revenue of $25.5 billion in Greater China driven by iPhone 17 demand.
Bearish momentum clashes with oversold signals as rebound looms
Momentum signals on the D1 chart are predominantly bearish, with the MACD and ADX both indicating weak, seller-driven momentum. Oscillators confirm an oversold environment: the RSI is 36.8 (sell), Stoch RSI is 16.24 (oversold), and CCI reads –128.64 (oversold); BBP also shows sellers’ dominance. The Awesome Oscillator is negative, matching the overall trend. Today’s session opened at $248.00 with a slight downward gap from the prior close ($249.94), but the price has edged up by 0.32%. Trading is near the session high ($247.32 – $248.59), reflecting mild upward pressure after the open amid low intraday volatility and some stabilization off session lows. This creates a divergence: while momentum remains soft and bearish, oversold oscillators suggest potential for a short-term technical rebound if seller pressure weakens.
Sideways price band likely as weak momentum meets oversold support
For the next five trading days, the expected price range is $242.00 to $258.00, reflecting typical volatility around the current level. The probability of a price increase is very low (less than 20%), making further decline the more likely outcome. In the baseline scenario, AAPL remains within a sideways band as oversold conditions and weak momentum counterbalance each other. A forceful move above $264.65 (Kijun/Ichimoku resistance) would signal recovery and potential exit from oversold conditions, while a drop below $246.00 could expose the price to further downside unless the longer-term support from the SMA-200 holds.
Earlier, analysts noted that Apple's share price was being driven more by macroeconomic uncertainty and central bank policy than by its underlying product fundamentals. The current environment, marked by continued downward momentum and emerging oversold signals, suggests traders should closely monitor the $246 support and $264.65 resistance as pivotal levels that could define the stock's next directional move.


-
 Afghanistan
-
 Albania
-
 Algeria
-
 Angola
-
 Argentina
-
 Armenia
-
 Australia
-
 Austria
-
 Azerbaijan
-
 Bahamas
-
 Bahrain
-
 Bangladesh
-
 Belarus
-
 Belgium
-
 Bolivia
-
 Botswana
-
 Brazil
-
 Brunei
-
 Bulgaria
-
 Cambodia
-
 Cameroon
-
 Canada
-
 Chile
Chile
-
 China
China
-
 Colombia
-
 Congo
Congo
-
 Costa Rica
-
 Cote d'Ivoire
-
 Croatia
-
 Cuba
Cuba
-
 Cyprus
-
 Czechia
-
 DR Congo
-
 Denmark
-
 Dominican Republic
-
 Ecuador
-
 Egypt
Egypt
-
 El Salvador
-
 Estonia
-
 Eswatini
-
 Ethiopia
-
 Finland
-
 France
-
 Georgia
-
 Germany
-
 Ghana
Ghana
-
 Greece
-
 Haiti
Haiti
-
 Hong Kong
-
 Hungary
-
 India
India
-
 Indonesia
-
 Iran, Islamic republic
-
 Iraq
Iraq
-
 Ireland
-
 Israel
-
 Italy
Italy
-
 Jamaica
-
 Japan
Japan
-
 Jordan
-
 Kazakhstan
-
 Kenya
Kenya
-
 Korea
Korea
-
 Kuwait
-
 Kyrgyzstan
-
 Laos
Laos
-
 Latvia
-
 Lebanon
-
 Lesotho
-
 Libya
Libya
-
 Lithuania
-
 Luxembourg
-
 Madagascar
-
 Malaysia
-
 Malta
Malta
-
 Mauritius
-
 Mexico
-
 Moldova
-
 Mongolia
-
 Montenegro
-
 Morocco
-
 Mozambique
-
 Myanmar
-
 Namibia
-
 Nepal
Nepal
-
 Netherlands
-
 New Zealand
-
 Nigeria
-
 North Macedonia
-
 Norway
-
 Oman
Oman
-
 Pakistan
-
 Palestine
-
 Panama
-
 Papua New Guinea
-
 Paraguay
-
 Peru
Peru
-
 Philippines
-
 Poland
-
 Portugal
-
 Puerto Rico
-
 Qatar
Qatar
-
 Reunion
-
 Romania
-
 Rwanda
-
 Saudi Arabia
-
 Serbia
-
 Singapore
-
 Slovakia
-
 Slovenia
-
 Somalia
-
 South Africa
-
 Spain
Spain
-
 Sri Lanka
-
 Sweden
-
 Switzerland
-
 Syria
Syria
-
 Taiwan
-
 Tajikistan
-
 Tanzania
-
 Thailand
-
 Trinidad and Tobago
-
 Tunisia
-
 Turkey
-
 UAE
UAE
-
 Uganda
-
 Ukraine
-
 United Kingdom
-
United States
-
 Uruguay
-
 Uzbekistan
-
 Venezuela
-
 Vietnam
-
 Yemen
Yemen
-
 Zambia
-
 Zimbabwe
- Forex
- Crypto
