
Tesla stock slides after US tariffs hit Chinese LFP battery margins

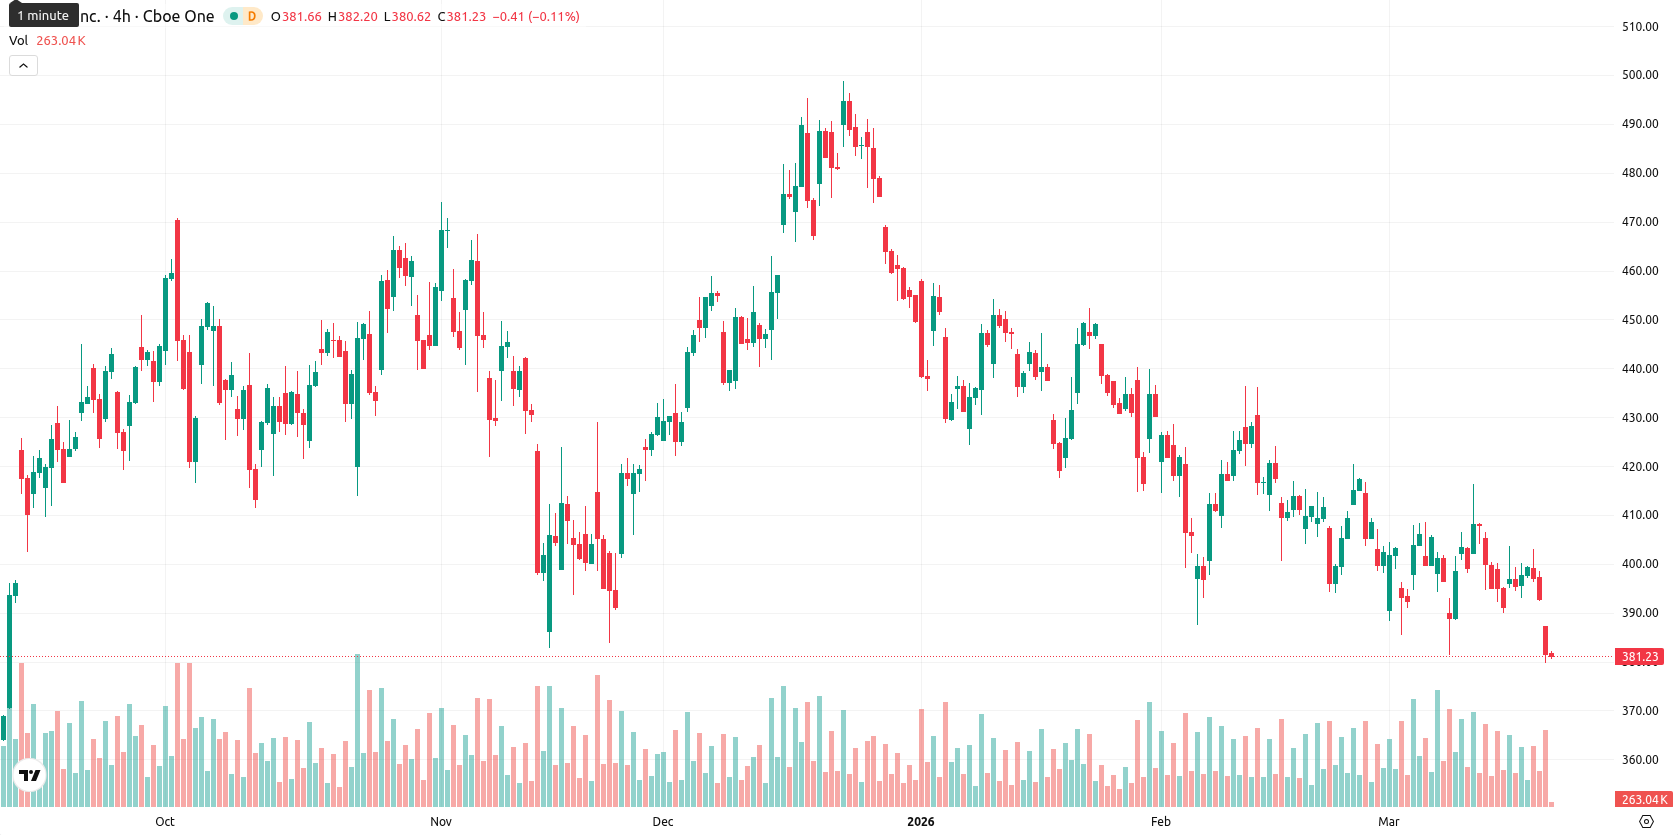
Tesla, Inc. (TSLA) is trading at $382.72, marking a decline of $9.84 or 2.51% for the day. The price remains below the SMA-20 at $402.23, SMA-50 at $417.61, and SMA-200 at $394.07, reflecting sustained seller pressure across all tracked timeframes.
Highlights
- A federal court granted class-action status to litigation alleging Tesla operates an unlawful monopoly on vehicle parts and repairs.
- Tesla is restructuring supply chains and domestic sourcing to offset margin pressures from tariffs and regulatory risks impacting its energy division.
- Tesla's share price remains under sustained selling pressure, with technical signals confirming a bearish trend and a near-term trading range of $372–$390.
Regulatory headwinds and supply chain shifts deepen selling pressure
A federal judge in Northern California has granted class-action status to litigation alleging Tesla maintains an illegal monopoly over its vehicle parts and repair services. US tariffs on Chinese LFP batteries have reduced margins in Tesla's energy division, resulting in adjustments to domestic supply strategies. In addition, federal authorities advanced their investigation into Tesla's Full Self-Driving software after documenting more incidents under low-visibility conditions. The company is also restructuring its semiconductor and battery supply chains to mitigate the impact of global geopolitical tensions and trade risks, while recent regulatory filings enabled the conversion of its xAI investment into a SpaceX stake, though price action has remained under broader selling pressure.
Bearish momentum confirmed as technical resistance and indicators align
TSLA is trading under the SMA-20, SMA-50, and SMA-200, with all trend-following and momentum indicators supporting a bearish bias. The Ichimoku Kijun at $408.88 acts as immediate resistance, while the ADX at 21.21 signals moderate trend strength. Oscillators and momentum indicators remain negative: the RSI at 41.85, Stoch RSI in the sell zone (not yet oversold), CCI at -72.95, and MACD confirming strong sell pressure. The BBP signals overbought conditions, and the Awesome Oscillator further corroborates the prevailing downward trend.
Limited rebound odds as volatility and resistance cap short-term outlook
Over the next five trading days, TSLA is expected to fluctuate within the $372 to $390 volatility band relative to current levels. With persistent sell signals, the likelihood of an upward move is less than 20%, while a breakdown below $372 could trigger further short-term declines. A reversal requires a decisive breakout above resistance at $408.88, which is not currently supported by technical indicators. The base scenario favors sideways-to-down movement due to continued weak demand and strong overhead resistance.
Previously it was reported that Tesla continued to face broad-based selling pressure despite strategic initiatives and major supply deals. The latest developments, including regulatory setbacks and headwinds from tariffs and investigations, add further weight to the bearish trend, with traders advised to monitor for a potential breakdown below $372 as a trigger for additional downside in the near term.


Latest Tesla News


-
 Afghanistan
-
 Albania
-
 Algeria
-
 Angola
-
 Argentina
-
 Armenia
-
 Australia
-
 Austria
-
 Azerbaijan
-
 Bahamas
-
 Bahrain
-
 Bangladesh
-
 Belarus
-
 Belgium
-
 Bolivia
-
 Botswana
-
 Brazil
-
 Brunei
-
 Bulgaria
-
 Cambodia
-
 Cameroon
-
 Canada
-
 Chile
Chile
-
 China
China
-
 Colombia
-
 Congo
Congo
-
 Costa Rica
-
 Cote d'Ivoire
-
 Croatia
-
 Cuba
Cuba
-
 Cyprus
-
 Czechia
-
 DR Congo
-
 Denmark
-
 Dominican Republic
-
 Ecuador
-
 Egypt
Egypt
-
 El Salvador
-
 Estonia
-
 Eswatini
-
 Ethiopia
-
 Finland
-
 France
-
 Georgia
-
 Germany
-
 Ghana
Ghana
-
 Greece
-
 Haiti
Haiti
-
 Hong Kong
-
 Hungary
-
 India
India
-
 Indonesia
-
 Iran, Islamic republic
-
 Iraq
Iraq
-
 Ireland
-
 Israel
-
 Italy
Italy
-
 Jamaica
-
 Japan
Japan
-
 Jordan
-
 Kazakhstan
-
 Kenya
Kenya
-
 Korea
Korea
-
 Kuwait
-
 Kyrgyzstan
-
 Laos
Laos
-
 Latvia
-
 Lebanon
-
 Lesotho
-
 Libya
Libya
-
 Lithuania
-
 Luxembourg
-
 Madagascar
-
 Malaysia
-
 Malta
Malta
-
 Mauritius
-
 Mexico
-
 Moldova
-
 Mongolia
-
 Montenegro
-
 Morocco
-
 Mozambique
-
 Myanmar
-
 Namibia
-
 Nepal
Nepal
-
 Netherlands
-
 New Zealand
-
 Nigeria
-
 North Macedonia
-
 Norway
-
 Oman
Oman
-
 Pakistan
-
 Palestine
-
 Panama
-
 Papua New Guinea
-
 Paraguay
-
 Peru
Peru
-
 Philippines
-
 Poland
-
 Portugal
-
 Puerto Rico
-
 Qatar
Qatar
-
 Reunion
-
 Romania
-
 Rwanda
-
 Saudi Arabia
-
 Serbia
-
 Singapore
-
 Slovakia
-
 Slovenia
-
 Somalia
-
 South Africa
-
 Spain
Spain
-
 Sri Lanka
-
 Sweden
-
 Switzerland
-
 Syria
Syria
-
 Taiwan
-
 Tajikistan
-
 Tanzania
-
 Thailand
-
 Trinidad and Tobago
-
 Tunisia
-
 Turkey
-
 UAE
UAE
-
 Uganda
-
 Ukraine
-
 United Kingdom
-
United States
-
 Uruguay
-
 Uzbekistan
-
 Venezuela
-
 Vietnam
-
 Yemen
Yemen
-
 Zambia
-
 Zimbabwe
- Forex
- Crypto
