
Robinhood stock falls as selling pressure persists below key moving averages

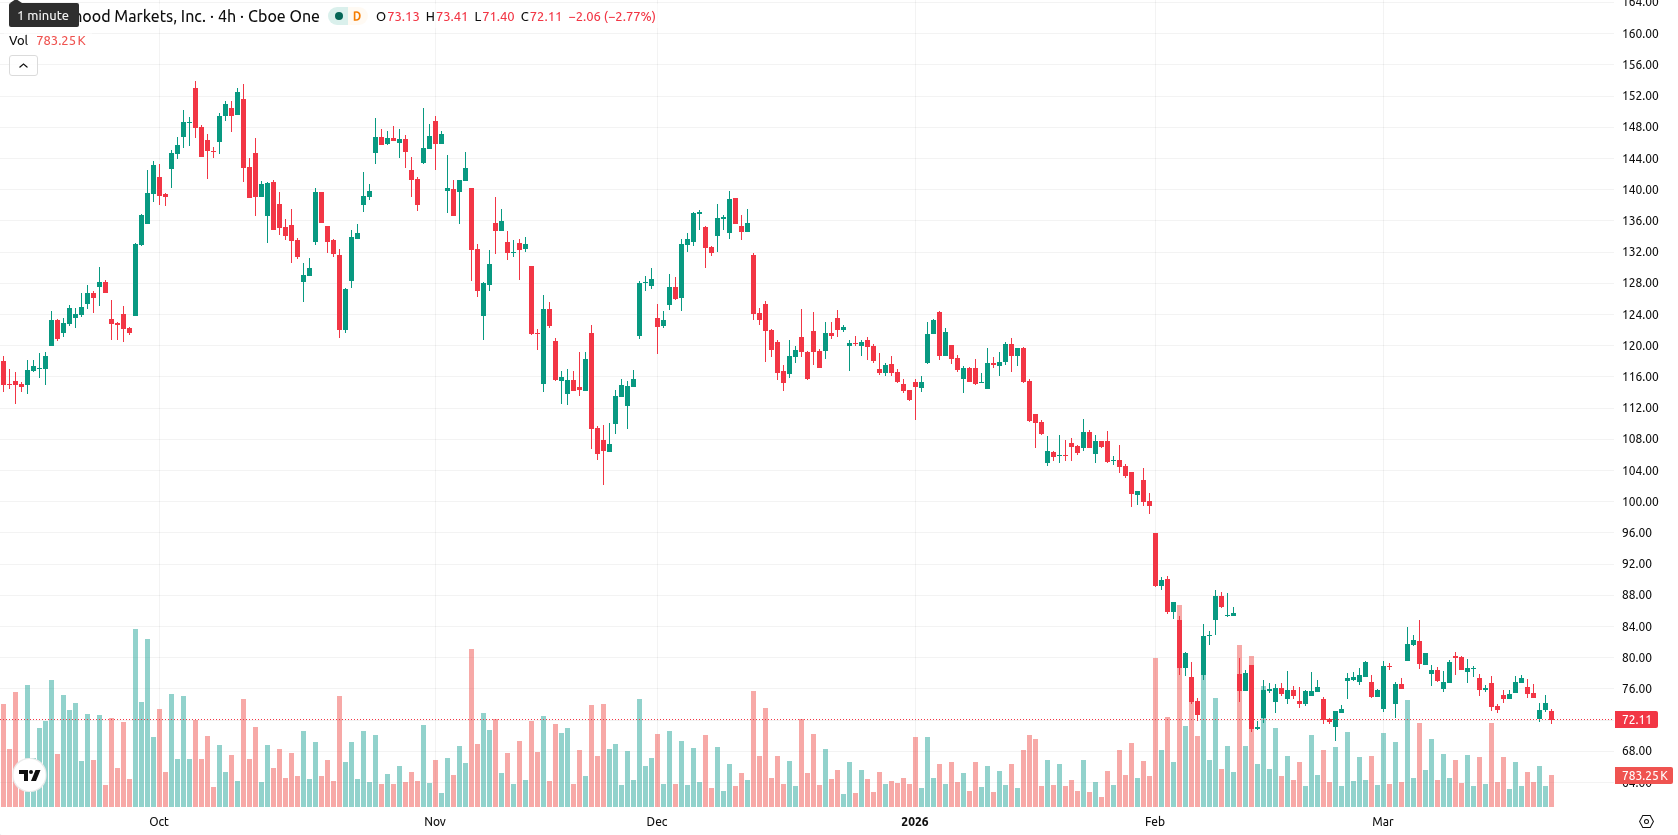
Robinhood Markets Inc (HOOD) is trading at $71.88, down 3.07% for the day and positioned below its key moving averages — SMA-20 ($76.83), SMA-50 ($88.77), and SMA-200 ($107.85) — signaling ongoing seller pressure across all timeframes.
Highlights
- Robinhood launched a beta for its verified social trading platform, Robinhood Social, with an initial 1,000-user rollout and upcoming broader access.
- Recent feature updates include trust accounts, enhanced investment strategies, and family investing tools, despite ongoing selling pressure in shares.
- The price of HOOD trades below key moving averages with strong bearish momentum, targeting a $64.00–$75.00 range amid low odds of a near-term rebound.
Options demand rises as Robinhood Social beta and product updates debut
On March 19, 2026, Robinhood began beta testing its new verified social trading platform, Robinhood Social, with an initial rollout to 1,000 users and plans for broader access in the coming weeks. The company also recently introduced trust accounts, enhanced investment strategies, and family investing tools. Options volume turned significantly higher with a put/call ratio above average, and no other material developments were reported, though price action has remained under broader selling pressure.
Bearish momentum confirmed as HOOD breaks technical supports
HOOD remains under decisive bearish momentum, with the price below the SMA-20, SMA-50, and SMA-200, indicating pervasive seller control from short to long-term horizons. The Ichimoku Kijun level on the daily chart stands at $76.99 as immediate resistance. Momentum indicators confirm this negative bias: MACD signals a strong sell, ADX indicates trend strength, and daily and weekly RSI (41.12 D1, 34.59 W1), CCI (–106.95 D1), and BBP (–1.52 D1) all reflect oversold conditions. A minor gap lower at the open has left the price near session lows, confirming intraday volatility and further downside follow-through, while Stoch RSI is neutral on the daily timeframe but signals oversold or potential buy setups on shorter intervals — though these are outweighed by dominant downside momentum.
Sideways outlook favored as resistance curbs rebound potential
For the coming five trading days, HOOD is forecast to fluctuate within a typical volatility band of $64.00 to $75.00. There is a very low probability (less than 20%) that price will sustain a meaningful rebound. The baseline scenario anticipates sideways movement between current support and resistance. A bullish break above the $76.99 Kijun level could open room to retest the $75.00 – $77.00 range, while continued selling would bring the $64.00 – $66.00 support zone into play, with negative signals and strong resistance capping the near-term outlook.
Previously it was reported that Robinhood was experiencing persistent bearish momentum driven by high volatility and overall negative technical signals. The latest analysis reinforces this outlook and highlights that, unless the price can decisively reclaim resistance above the Ichimoku Kijun at $76.99, traders should be alert to further downside risk into the $64.00–$66.00 support band.


Latest Robinhood News


-
 Afghanistan
-
 Albania
-
 Algeria
-
 Angola
-
 Argentina
-
 Armenia
-
 Australia
-
 Austria
-
 Azerbaijan
-
 Bahamas
-
 Bahrain
-
 Bangladesh
-
 Belarus
-
 Belgium
-
 Bolivia
-
 Botswana
-
 Brazil
-
 Brunei
-
 Bulgaria
-
 Cambodia
-
 Cameroon
-
 Canada
-
 Chile
Chile
-
 China
China
-
 Colombia
-
 Congo
Congo
-
 Costa Rica
-
 Cote d'Ivoire
-
 Croatia
-
 Cuba
Cuba
-
 Cyprus
-
 Czechia
-
 DR Congo
-
 Denmark
-
 Dominican Republic
-
 Ecuador
-
 Egypt
Egypt
-
 El Salvador
-
 Estonia
-
 Eswatini
-
 Ethiopia
-
 Finland
-
 France
-
 Georgia
-
 Germany
-
 Ghana
Ghana
-
 Greece
-
 Haiti
Haiti
-
 Hong Kong
-
 Hungary
-
 India
India
-
 Indonesia
-
 Iran, Islamic republic
-
 Iraq
Iraq
-
 Ireland
-
 Israel
-
 Italy
Italy
-
 Jamaica
-
 Japan
Japan
-
 Jordan
-
 Kazakhstan
-
 Kenya
Kenya
-
 Korea
Korea
-
 Kuwait
-
 Kyrgyzstan
-
 Laos
Laos
-
 Latvia
-
 Lebanon
-
 Lesotho
-
 Libya
Libya
-
 Lithuania
-
 Luxembourg
-
 Madagascar
-
 Malaysia
-
 Malta
Malta
-
 Mauritius
-
 Mexico
-
 Moldova
-
 Mongolia
-
 Montenegro
-
 Morocco
-
 Mozambique
-
 Myanmar
-
 Namibia
-
 Nepal
Nepal
-
 Netherlands
-
 New Zealand
-
 Nigeria
-
 North Macedonia
-
 Norway
-
 Oman
Oman
-
 Pakistan
-
 Palestine
-
 Panama
-
 Papua New Guinea
-
 Paraguay
-
 Peru
Peru
-
 Philippines
-
 Poland
-
 Portugal
-
 Puerto Rico
-
 Qatar
Qatar
-
 Reunion
-
 Romania
-
 Rwanda
-
 Saudi Arabia
-
 Serbia
-
 Singapore
-
 Slovakia
-
 Slovenia
-
 Somalia
-
 South Africa
-
 Spain
Spain
-
 Sri Lanka
-
 Sweden
-
 Switzerland
-
 Syria
Syria
-
 Taiwan
-
 Tajikistan
-
 Tanzania
-
 Thailand
-
 Trinidad and Tobago
-
 Tunisia
-
 Turkey
-
 UAE
UAE
-
 Uganda
-
 Ukraine
-
 United Kingdom
-
United States
-
 Uruguay
-
 Uzbekistan
-
 Venezuela
-
 Vietnam
-
 Yemen
Yemen
-
 Zambia
-
 Zimbabwe
- Forex
- Crypto
