
Rising CPU prices and foundry delays lift Intel stock despite mixed momentum indicators

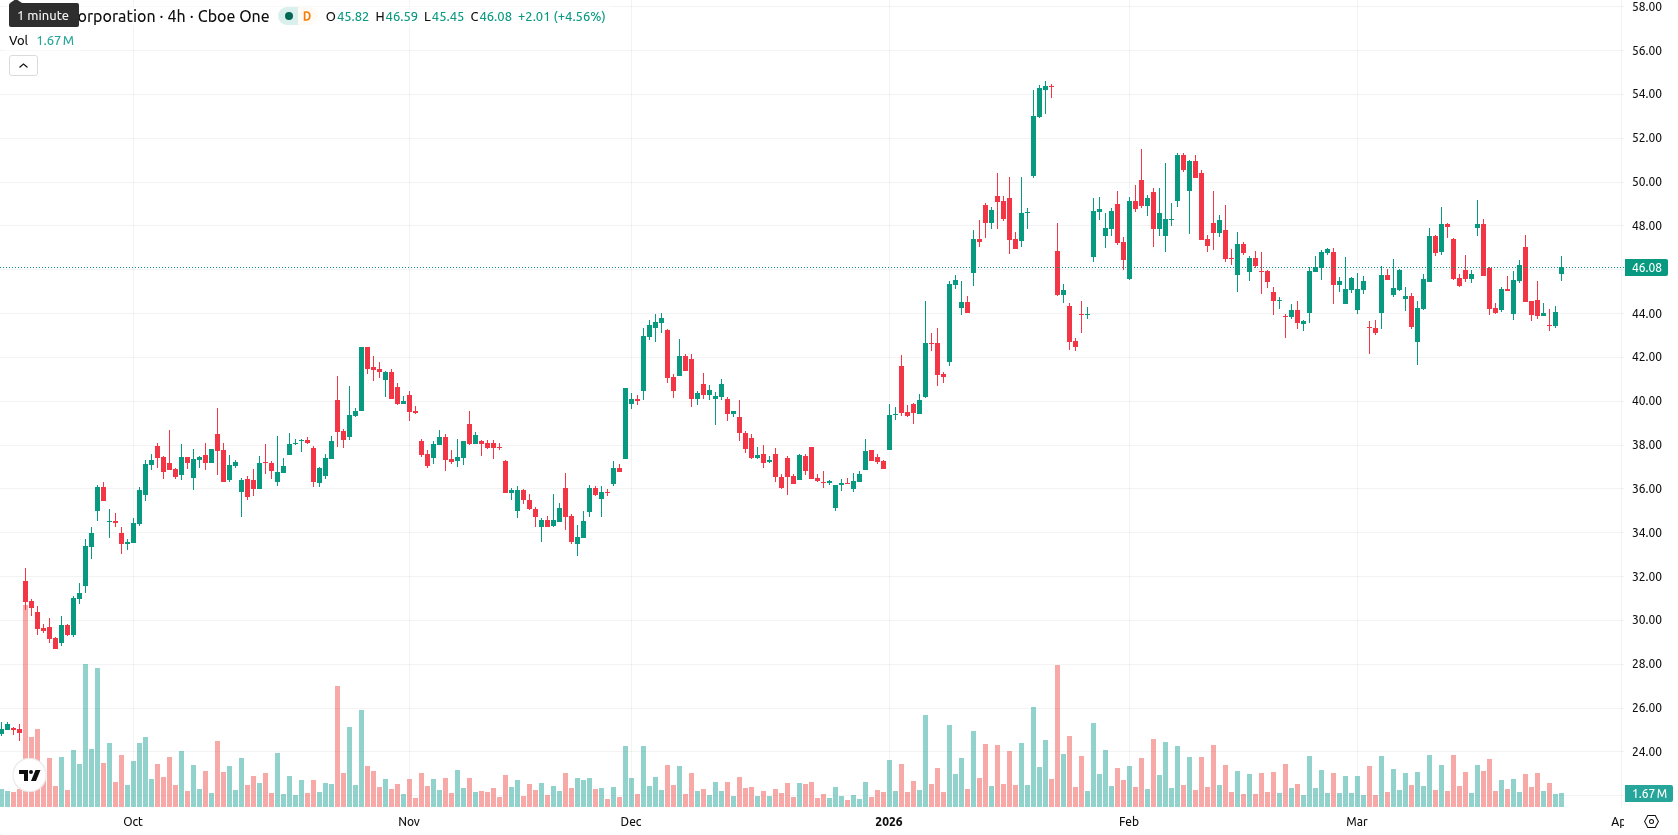
Intel Corporation (INTC) is trading at $46.13, above the MA-20 ($45.29) but slightly below the MA-50 ($46.57), indicating short-term upward momentum but some lingering medium-term resistance. The price is well above the MA-200 ($34.43), supporting a longer-term bullish outlook, while the Ichimoku Kijun at $45.41 acts as immediate support.
Highlights
- Intel raised processor prices and notified clients of higher CPU charges, prompting a notable market reaction amid intense AI chip competition.
- Recent foundry production delays and a 12% reduction in Intel holdings by Diversified Trust Co. reflect investor concerns and position adjustments.
- Technicals show Intel trading in a $44.00 to $47.00 range, with mixed momentum signals but a high probability of short-term price consolidation or upside.
Sentiment shifts as Intel ups prices and investors retrench
Intel raises CPU prices as it and Advanced Micro Devices inform clients of increased processor charges, sparking a significant market reaction. The company faces ongoing competition in the AI chip space, with recent foundry delays creating further scrutiny around execution. Investors are closely watching for government support via the CHIPS Act, while Diversified Trust Co. disclosed a 12% reduction in its Intel holdings by selling 11,796 shares and retaining 86,294 shares at the close of the fourth quarter.
Diverging momentum signals as volatility follows early gap
Momentum indicators present a mixed outlook for INTC: MACD signals a sell, ADX on D1 is neutral with limited trend strength, and both RSI and CCI are at oversold levels. Stoch RSI also shows oversold conditions, while Bull/Bear Power (BBP) suggests seller dominance. The stock gapped up from $44.08 to an opening of $46.55 and has since pulled back, now trading in the middle of today's range ($45.97 to $46.59), highlighting moderate volatility and some pressure after the open. Despite today's 4.66% gain, momentum signals are not fully aligned, and diverging oscillators indicate persistent uncertainty. Key support is at the Ichimoku Kijun ($45.41), with resistance at the MA-50 ($46.57).
High upside odds as INTC consolidates in volatility band
In the short term, the expected price range for INTC over the next five trading days is $44.00 to $47.00, reflecting a typical volatility band relative to current levels. There is a very high probability (over 80%) of a price increase, while the chance of a decline is low. The baseline scenario sees INTC consolidating sideways between support and resistance. A bullish breakout above $47.00 is possible if momentum strengthens, while a drop below $44.00 could trigger further losses, though this is less likely given the prevailing long-term bullish indicators.
Earlier, analysts noted that despite near-term volatility and seller pressure, Intel maintained a constructive long-term outlook due to strong institutional interest and technical support. The current analysis adds a layer of uncertainty with mixed momentum signals and institutional selling, making the $47.00 resistance level especially crucial for gauging whether a bullish breakout or renewed downside risk will emerge in the days ahead.


-
 Afghanistan
-
 Albania
-
 Algeria
-
 Angola
-
 Argentina
-
 Armenia
-
 Australia
-
 Austria
-
 Azerbaijan
-
 Bahamas
-
 Bahrain
-
 Bangladesh
-
 Belarus
-
 Belgium
-
 Bolivia
-
 Botswana
-
 Brazil
-
 Brunei
-
 Bulgaria
-
 Cambodia
-
 Cameroon
-
 Canada
-
 Chile
Chile
-
 China
China
-
 Colombia
-
 Congo
Congo
-
 Costa Rica
-
 Cote d'Ivoire
-
 Croatia
-
 Cuba
Cuba
-
 Cyprus
-
 Czechia
-
 DR Congo
-
 Denmark
-
 Dominican Republic
-
 Ecuador
-
 Egypt
Egypt
-
 El Salvador
-
 Estonia
-
 Eswatini
-
 Ethiopia
-
 Finland
-
 France
-
 Georgia
-
 Germany
-
 Ghana
Ghana
-
 Greece
-
 Haiti
Haiti
-
 Hong Kong
-
 Hungary
-
 India
India
-
 Indonesia
-
 Iran, Islamic republic
-
 Iraq
Iraq
-
 Ireland
-
 Israel
-
 Italy
Italy
-
 Jamaica
-
 Japan
Japan
-
 Jordan
-
 Kazakhstan
-
 Kenya
Kenya
-
 Korea
Korea
-
 Kuwait
-
 Kyrgyzstan
-
 Laos
Laos
-
 Latvia
-
 Lebanon
-
 Lesotho
-
 Libya
Libya
-
 Lithuania
-
 Luxembourg
-
 Madagascar
-
 Malaysia
-
 Malta
Malta
-
 Mauritius
-
 Mexico
-
 Moldova
-
 Mongolia
-
 Montenegro
-
 Morocco
-
 Mozambique
-
 Myanmar
-
 Namibia
-
 Nepal
Nepal
-
 Netherlands
-
 New Zealand
-
 Nigeria
-
 North Macedonia
-
 Norway
-
 Oman
Oman
-
 Pakistan
-
 Palestine
-
 Panama
-
 Papua New Guinea
-
 Paraguay
-
 Peru
Peru
-
 Philippines
-
 Poland
-
 Portugal
-
 Puerto Rico
-
 Qatar
Qatar
-
 Reunion
-
 Romania
-
 Rwanda
-
 Saudi Arabia
-
 Serbia
-
 Singapore
-
 Slovakia
-
 Slovenia
-
 Somalia
-
 South Africa
-
 Spain
Spain
-
 Sri Lanka
-
 Sweden
-
 Switzerland
-
 Syria
Syria
-
 Taiwan
-
 Tajikistan
-
 Tanzania
-
 Thailand
-
 Trinidad and Tobago
-
 Tunisia
-
 Turkey
-
 UAE
UAE
-
 Uganda
-
 Ukraine
-
 United Kingdom
-
United States
-
 Uruguay
-
 Uzbekistan
-
 Venezuela
-
 Vietnam
-
 Yemen
Yemen
-
 Zambia
-
 Zimbabwe
- Forex
- Crypto
