The tweet was deleted by the author.
But we saved everything 🙂.

Robinhood Markets Inc. (HOOD) is trading at $72.65, up $3.57 or 5.17% from the previous close after opening with a clear upward gap. The stock saw early strength but is now back to mid-range territory following high intraday volatility, as sellers regained control and initial momentum faded. The rise is attributed to a recent company communication highlighting market expectations for gold, coupled with renewed attention to Robinhood's capital return strategies.
Robinhood's official account announced a 51% chance that gold prices hit $4,600 or above by March 31st, underscoring the platform's focus on event-driven trading opportunities and quantitative market outlooks. The tone was promotional, aiming to engage retail traders and spotlight Robinhood's growing suite of derivative products, which could impact user engagement and overall trading volumes. Broader news highlights the company’s recent authorization of a $1.5 billion share buyback program, extending capital returns and supporting the stock amid recent volatility.
HOOD's price is below the MA-20 ($76.39), MA-50 ($86.07), and MA-200 ($107.83), indicating downside pressure across all major timeframes. The Ichimoku Kijun at $76.68 is the nearest dynamic resistance, with no significant support above the 20-day moving average. MACD and RSI both reflect pronounced bearish momentum and oversold conditions, suggesting continued weakness. The 5-day forecast range is $69.79 – $74.74, with downside risk remaining dominant barring a move above $76.68.
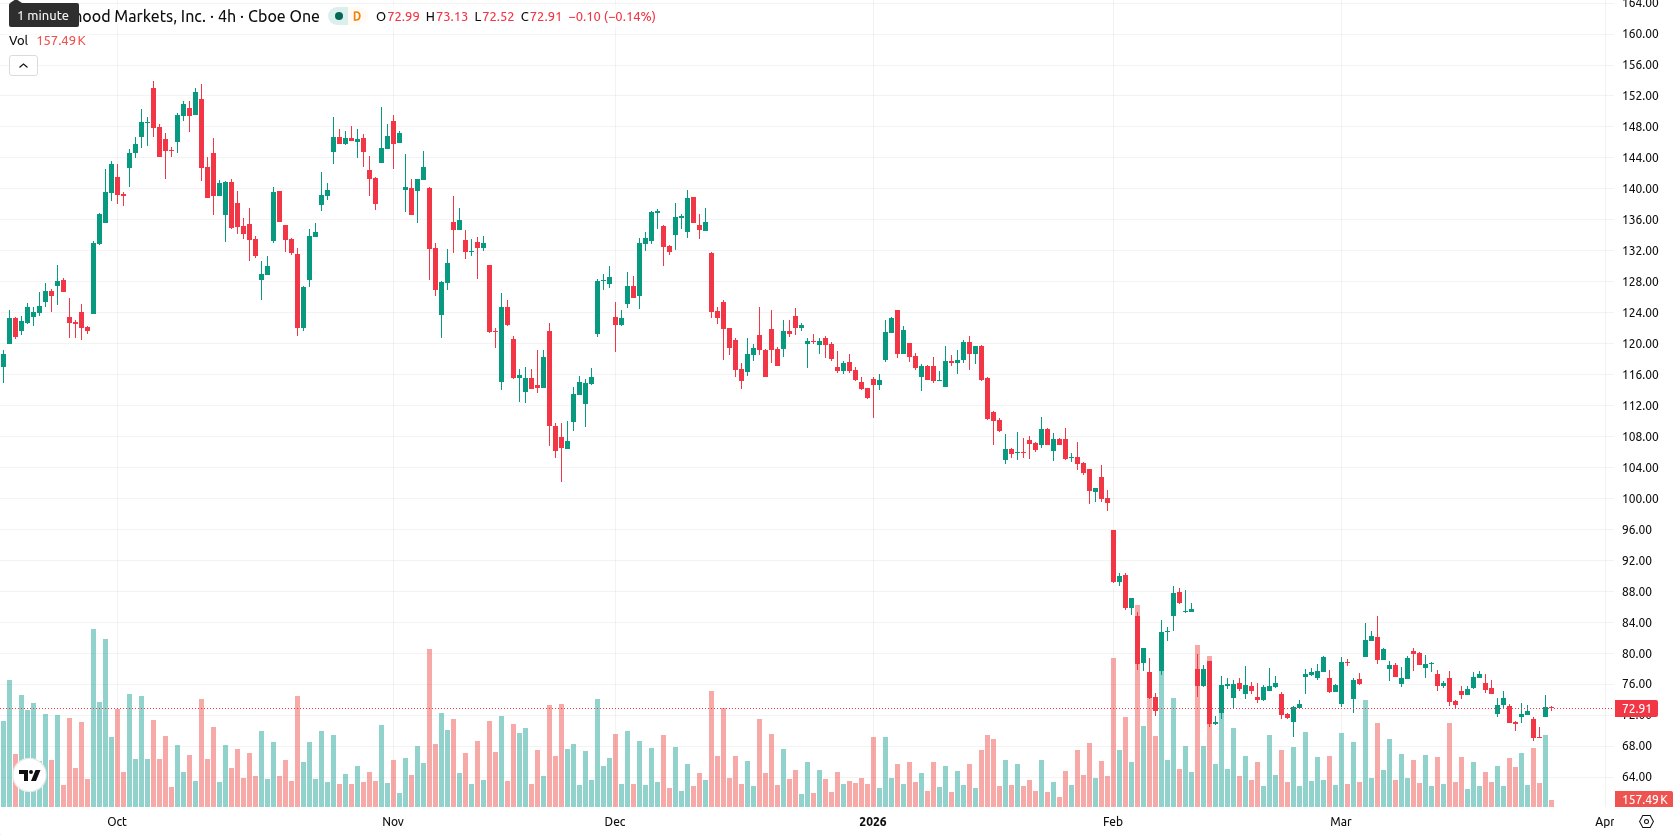
Previously it was reported that Robinhood continued to face technical and sentiment-based headwinds despite management's ongoing share buyback initiatives. As the current environment evolves, investors should closely monitor for a sustained shift in momentum as any decisive move could help clarify whether the seller-driven trend is set to persist or reverse.

 Afghanistan
 Albania
 Algeria
 Angola
 Argentina
 Armenia
 Australia
 Austria
 Azerbaijan
 Bahamas
 Bahrain
 Bangladesh
 Belarus
 Belgium
 Bolivia
 Botswana
 Brazil
 Brunei
 Bulgaria
 Cambodia
 Cameroon
 Canada
 Chile
Chile
 China
China
 Colombia
 Congo
Congo
 Costa Rica
 Cote d'Ivoire
 Croatia
 Cuba
Cuba
 Cyprus
 Czechia
 DR Congo
 Denmark
 Dominican Republic
 Ecuador
 Egypt
Egypt
 El Salvador
 Estonia
 Eswatini
 Ethiopia
 Finland
 France
 Georgia
 Germany
 Ghana
Ghana
 Greece
 Haiti
Haiti
 Hong Kong
 Hungary
 India
India
 Indonesia
 Iran, Islamic republic
 Iraq
Iraq
 Ireland
 Israel
 Italy
Italy
 Jamaica
 Japan
Japan
 Jordan
 Kazakhstan
 Kenya
Kenya
 Korea
Korea
 Kuwait
 Kyrgyzstan
 Laos
Laos
 Latvia
 Lebanon
 Lesotho
 Libya
Libya
 Lithuania
 Luxembourg
 Madagascar
 Malaysia
 Malta
Malta
 Mauritius
 Mexico
 Moldova
 Mongolia
 Montenegro
 Morocco
 Mozambique
 Myanmar
 Namibia
 Nepal
Nepal
 Netherlands
 New Zealand
 Nigeria
 North Macedonia
 Norway
 Oman
Oman
 Pakistan
 Palestine
 Panama
 Papua New Guinea
 Paraguay
 Peru
Peru
 Philippines
 Poland
 Portugal
 Puerto Rico
 Qatar
Qatar
 Reunion
 Romania
 Rwanda
 Saudi Arabia
 Serbia
 Singapore
 Slovakia
 Slovenia
 Somalia
 South Africa
 Spain
Spain
 Sri Lanka
 Sweden
 Switzerland
 Syria
Syria
 Taiwan
 Tajikistan
 Tanzania
 Thailand
 Trinidad and Tobago
 Tunisia
 Turkey
 UAE
UAE
 Uganda
 Ukraine
 United Kingdom
United States
United Kingdom
United States
 Uruguay
 Uzbekistan
 Venezuela
 Vietnam
 Yemen
Yemen
 Zambia
 Zimbabwe