
Natural gas price forecast: Recovery gains traction as geopolitical support pushes price toward $3.02

Natural gas is at $2.97 this morning. 2 days ago, it was testing $2.85 and looked like it could break lower. It held. Buyers came in twice at that level, and the market has been grinding higher since. RSI is in the low 60s for the first time since early March. That is a different picture from what this chart showed last week.
Highlights
- Price at $2.97, back above the 20 and 50-period EMAs after holding the $2.85 low on 2 separate tests.
- RSI at 61, signal line at 57. RSI is leading higher, and the gap between the 2 is widening.
- $2.94 to $2.95 is now supported. Resistance starts at $2.98 and runs up to $3.02.
The 20 and 50-period EMAs at $2.94 and $2.95 spent most of last week acting as a ceiling. Price is now above both. The 100-period EMA at $2.98 is the next test, sitting just above the current price. Above that, the 200-period EMA at $3.02 is where the market has twice turned buyers away in the past 2 weeks.
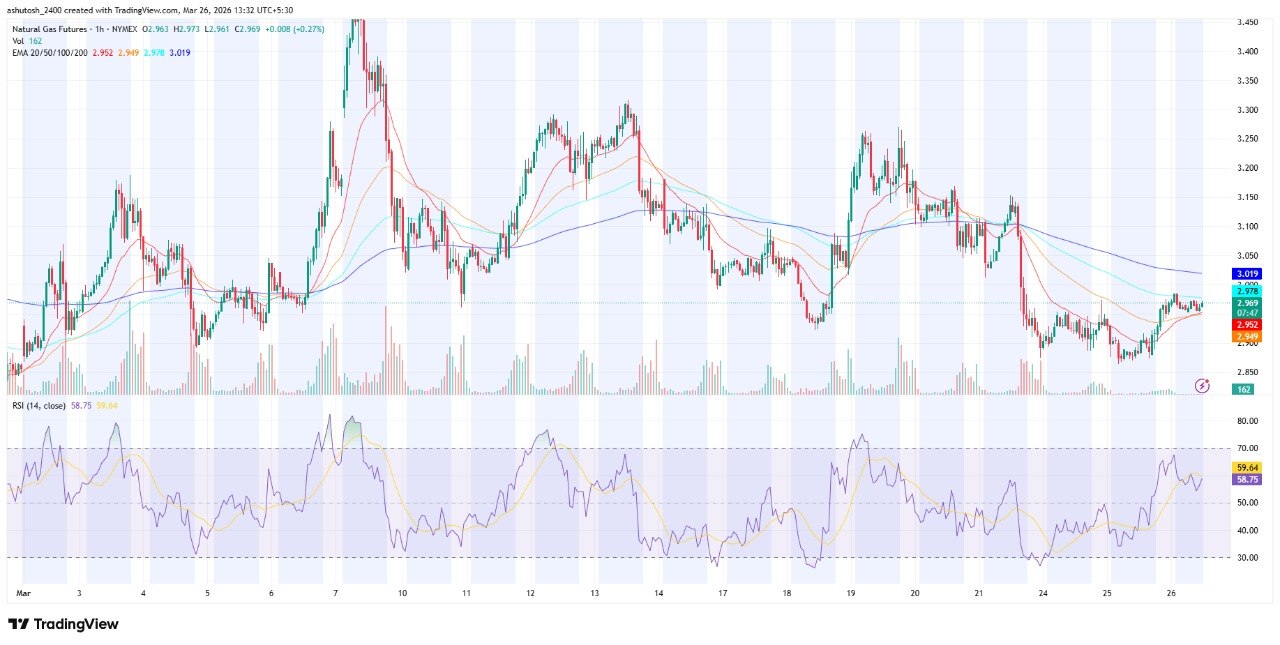
Natural gas price dynamics (March 2026). Source: TradingView.
$2.85 was tested on March 19 and again on March 24. Both times, buyers showed up fast. The bounce off the 2nd test has been steadier than the 1st, which is encouraging. Price has not spiked, it has just quietly moved higher each session. RSI at 61 with the signal line trailing at 57 is the best momentum reading this chart has produced since the March 7 spike to $3.47.
War risks and LNG demand offset mild weather pressure
Natural gas futures edged higher on March 25 as Tehran's rejection of a U.S. peace plan kept war risks in play, with LNG feed gas demand and bullish storage expectations adding support. Energy Information Administration, removing one of the more bearish arguments that had been weighing on the market through mid-March. ConocoPhillips CEO Ryan Lance noted that even if the Iran conflict ends quickly, a lift in global natural gas prices is likely locked in, given limited production on the horizon. That combination of tightening storage and geopolitical risk is what has kept $2.85 from breaking, and is now pushing prices back toward $3.02.Back above key EMAs, but resistance remains close
Getting through $2.98 cleanly matters. That is the 100-period EMA, and the price has not closed above it since the selloff started. The 200-period EMA at $3.02 is a bigger ask. It has been rejected price 2 times already. A 3rd test will either confirm the downtrend is over or add another lower high to the chart. The pattern of lower highs since March 7 remains technically intact until $3.10 is cleared.The technical structure shows a pause after rapid expansion
If natural gas holds above $2.94 and pushes through the $2.98 to $3.02 zone, a move toward $3.10 opens up. A close above $3.02 would be the first real signal that the downtrend has ended.If $2.94 fails on a pullback, the recovery loses credibility and $2.85 comes back into view. A break below $2.85 would remove the double-support structure and target $2.80.
In the previous analysis, $2.85 was flagged as the level that needed to be held before any recovery could develop. It held twice. The bounce has since confirmed that call, and the question now is whether the market can follow through above $3.02.


Latest Natural Gas News


-
 Afghanistan
-
 Albania
-
 Algeria
-
 Angola
-
 Argentina
-
 Armenia
-
 Australia
-
 Austria
-
 Azerbaijan
-
 Bahamas
-
 Bahrain
-
 Bangladesh
-
 Belarus
-
 Belgium
-
 Bolivia
-
 Botswana
-
 Brazil
-
 Brunei
-
 Bulgaria
-
 Cambodia
-
 Cameroon
-
 Canada
-
 Chile
Chile
-
 China
China
-
 Colombia
-
 Congo
Congo
-
 Costa Rica
-
 Cote d'Ivoire
-
 Croatia
-
 Cuba
Cuba
-
 Cyprus
-
 Czechia
-
 DR Congo
-
 Denmark
-
 Dominican Republic
-
 Ecuador
-
 Egypt
Egypt
-
 El Salvador
-
 Estonia
-
 Eswatini
-
 Ethiopia
-
 Finland
-
 France
-
 Georgia
-
 Germany
-
 Ghana
Ghana
-
 Greece
-
 Haiti
Haiti
-
 Hong Kong
-
 Hungary
-
 India
India
-
 Indonesia
-
 Iran, Islamic republic
-
 Iraq
Iraq
-
 Ireland
-
 Israel
-
 Italy
Italy
-
 Jamaica
-
 Japan
Japan
-
 Jordan
-
 Kazakhstan
-
 Kenya
Kenya
-
 Korea
Korea
-
 Kuwait
-
 Kyrgyzstan
-
 Laos
Laos
-
 Latvia
-
 Lebanon
-
 Lesotho
-
 Libya
Libya
-
 Lithuania
-
 Luxembourg
-
 Madagascar
-
 Malaysia
-
 Malta
Malta
-
 Mauritius
-
 Mexico
-
 Moldova
-
 Mongolia
-
 Montenegro
-
 Morocco
-
 Mozambique
-
 Myanmar
-
 Namibia
-
 Nepal
Nepal
-
 Netherlands
-
 New Zealand
-
 Nigeria
-
 North Macedonia
-
 Norway
-
 Oman
Oman
-
 Pakistan
-
 Palestine
-
 Panama
-
 Papua New Guinea
-
 Paraguay
-
 Peru
Peru
-
 Philippines
-
 Poland
-
 Portugal
-
 Puerto Rico
-
 Qatar
Qatar
-
 Reunion
-
 Romania
-
 Rwanda
-
 Saudi Arabia
-
 Serbia
-
 Singapore
-
 Slovakia
-
 Slovenia
-
 Somalia
-
 South Africa
-
 Spain
Spain
-
 Sri Lanka
-
 Sweden
-
 Switzerland
-
 Syria
Syria
-
 Taiwan
-
 Tajikistan
-
 Tanzania
-
 Thailand
-
 Trinidad and Tobago
-
 Tunisia
-
 Turkey
-
 UAE
UAE
-
 Uganda
-
 Ukraine
-
 United Kingdom
-
United States
-
 Uruguay
-
 Uzbekistan
-
 Venezuela
-
 Vietnam
-
 Yemen
Yemen
-
 Zambia
-
 Zimbabwe
- Forex
- Crypto
