
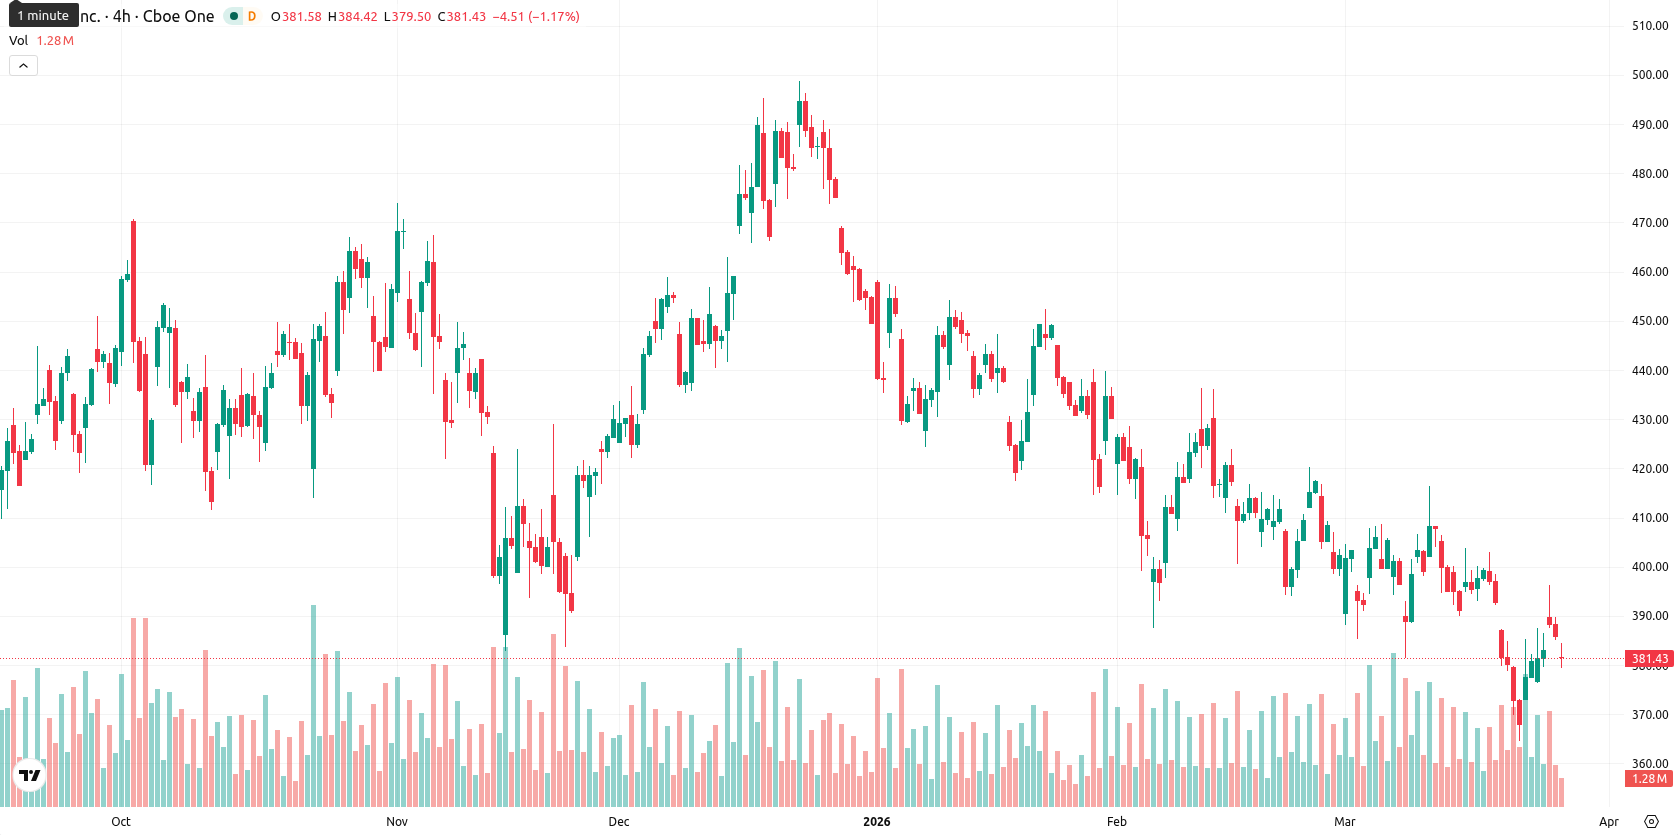
Tesla stock slips 1.19% as selling persists below major moving averages

Tesla, Inc. (TSLA) is trading at $381.20 after falling 1.19% today, positioning the shares below the MA-20 at $394.62, MA-50 at $411.69, and MA-200 at $395.56. This keeps TSLA below key moving averages and indicates sustained selling activity in the short, medium, and long term.
Highlights
- Tesla unveiled its 'Terafab' semiconductor project and expects Optimus robot production to begin this summer, driving renewed investor attention.
- Recent filings revealed net institutional buying of TSLA in Q4, while European registrations rebounded and Q1 delivery expectations improved despite ongoing price pressure.
- TSLA remains under broad selling pressure, trading below key technical levels with a downside-biased range of $379.00 to $389.50 forecast for the coming week.
Improved sentiment as buy-side flows counter regulatory reduction
Tesla recently announced its 'Terafab' semiconductor manufacturing project on March 26, 2026. The same day, regulatory filings disclosed new or increased TSLA stakes by Canvas Wealth Advisors LLC, Defender Capital LLC., and Bath Savings Trust Co during the fourth quarter, while Moody National Bank Trust Division reported a reduction. Tesla also began the third wave of its 2026.2.9.3 software update rollout and showcased progress in the Optimus robot, with production expected to start this summer. These events were accompanied by a rebound in European registrations and improved sentiment ahead of the upcoming Q1 delivery report, though price action has remained under broader selling pressure.
Weak momentum as resistance and overbought signals collide
TSLA remains below all major moving averages, with the Ichimoku Kijun level at $392.45 providing immediate resistance. Momentum on the daily timeframe is weak as reflected by bearish signals from both MACD and ADX, an RSI at 43.21 (Sell), CCI at -52.09, and a negative Awesome Oscillator. Stoch RSI is neutral but near overbought, while Bull/Bear Power (BBP) at 6.87, flagged as overbought, contrasts with prevailing downside momentum. The price sits near the lower end of today's range following an opening gap down, reflecting moderate volatility and persistent pressure, with short-term buying attempts at odds with the broader bearish trend.
Downside risk elevated as technicals cap breakout odds
Typical volatility for the next five trading days is expected to keep TSLA fluctuating between $379.00 and $389.50. Current momentum and trend indicators suggest a very low probability (less than 20%) of upside movement, with further declines more likely. The baseline outlook is for sideways trading within this corridor; a bullish shift would depend on a sustained break above $392.45, while a bearish scenario could intensify if support at $379.00 is breached. Technicals continue to indicate limited upside and heightened downside risk in the short term.
Earlier, analysts noted that Tesla continued to face broad selling pressure despite strategic initiatives and intermittent signs of positive momentum. The latest developments reinforce the prevailing bearish trend, making the $392.45 resistance level critical for any bullish reversal while a breakdown below $379.00 could accelerate further downside risk.


Latest Tesla News


-
 Afghanistan
-
 Albania
-
 Algeria
-
 Angola
-
 Argentina
-
 Armenia
-
 Australia
-
 Austria
-
 Azerbaijan
-
 Bahamas
-
 Bahrain
-
 Bangladesh
-
 Belarus
-
 Belgium
-
 Bolivia
-
 Botswana
-
 Brazil
-
 Brunei
-
 Bulgaria
-
 Cambodia
-
 Cameroon
-
 Canada
-
 Chile
Chile
-
 China
China
-
 Colombia
-
 Congo
Congo
-
 Costa Rica
-
 Cote d'Ivoire
-
 Croatia
-
 Cuba
Cuba
-
 Cyprus
-
 Czechia
-
 DR Congo
-
 Denmark
-
 Dominican Republic
-
 Ecuador
-
 Egypt
Egypt
-
 El Salvador
-
 Estonia
-
 Eswatini
-
 Ethiopia
-
 Finland
-
 France
-
 Georgia
-
 Germany
-
 Ghana
Ghana
-
 Greece
-
 Haiti
Haiti
-
 Hong Kong
-
 Hungary
-
 India
India
-
 Indonesia
-
 Iran, Islamic republic
-
 Iraq
Iraq
-
 Ireland
-
 Israel
-
 Italy
Italy
-
 Jamaica
-
 Japan
Japan
-
 Jordan
-
 Kazakhstan
-
 Kenya
Kenya
-
 Korea
Korea
-
 Kuwait
-
 Kyrgyzstan
-
 Laos
Laos
-
 Latvia
-
 Lebanon
-
 Lesotho
-
 Libya
Libya
-
 Lithuania
-
 Luxembourg
-
 Madagascar
-
 Malaysia
-
 Malta
Malta
-
 Mauritius
-
 Mexico
-
 Moldova
-
 Mongolia
-
 Montenegro
-
 Morocco
-
 Mozambique
-
 Myanmar
-
 Namibia
-
 Nepal
Nepal
-
 Netherlands
-
 New Zealand
-
 Nigeria
-
 North Macedonia
-
 Norway
-
 Oman
Oman
-
 Pakistan
-
 Palestine
-
 Panama
-
 Papua New Guinea
-
 Paraguay
-
 Peru
Peru
-
 Philippines
-
 Poland
-
 Portugal
-
 Puerto Rico
-
 Qatar
Qatar
-
 Reunion
-
 Romania
-
 Rwanda
-
 Saudi Arabia
-
 Serbia
-
 Singapore
-
 Slovakia
-
 Slovenia
-
 Somalia
-
 South Africa
-
 Spain
Spain
-
 Sri Lanka
-
 Sweden
-
 Switzerland
-
 Syria
Syria
-
 Taiwan
-
 Tajikistan
-
 Tanzania
-
 Thailand
-
 Trinidad and Tobago
-
 Tunisia
-
 Turkey
-
 UAE
UAE
-
 Uganda
-
 Ukraine
-
 United Kingdom
-
United States
-
 Uruguay
-
 Uzbekistan
-
 Venezuela
-
 Vietnam
-
 Yemen
Yemen
-
 Zambia
-
 Zimbabwe
- Forex
- Crypto
