
AMD stock slides 4.09% as overbought signals meet persistent selling pressure

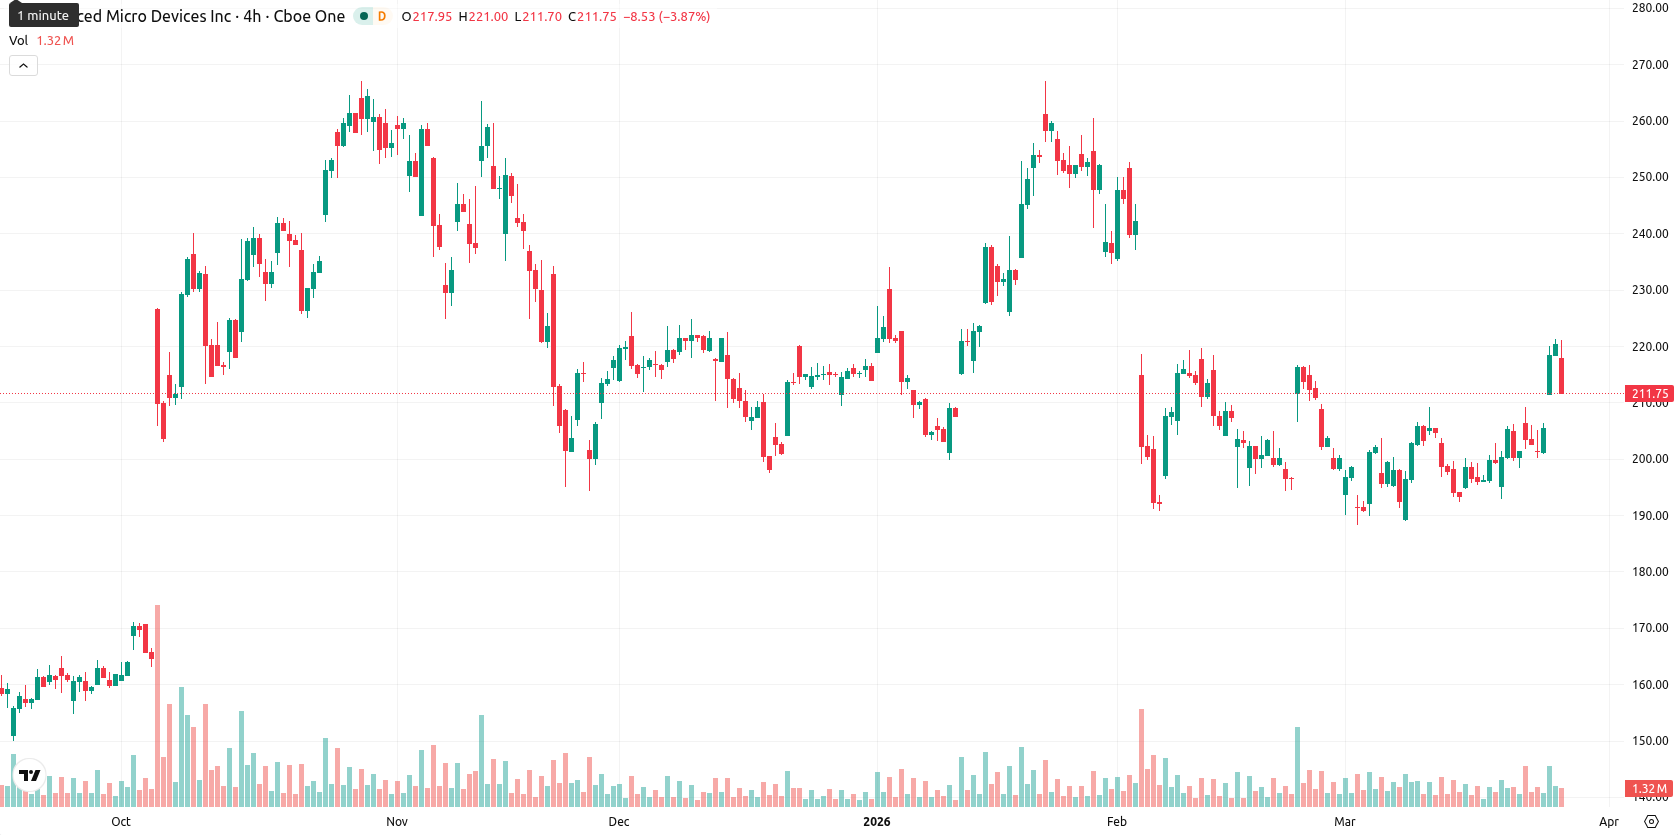
Advanced Micro Devices, Inc. (AMD) is trading at $211.30, down 4.09% for the day. The price remains above both its SMA-20 ($200.82) and SMA-200 ($194.35), while having slipped just below the SMA-50 ($214.69), indicating some medium-term resistance.
Highlights
- AMD is valued at a forward P/E of 26.64, but shares remain pressured by ongoing broad market weakness.
- Despite longer-term support, AMD trades below medium-term resistance and faces increased intraday volatility from sellers.
- Technical signals are mixed and overbought, with a high probability of consolidation in the $202–$223 range next week.
Valuation premium persists as broad selling intensifies pressure
Recent market coverage noted that AMD's current price-to-earnings ratio stands at 26.64 based on analysts' earnings estimates for the next 12 months, according to LSEG data, though price action has remained under broader selling pressure.
Mixed momentum as strong support meets overbought oscillators
AMD is holding above both its SMA-20 ($200.82) and SMA-200 ($194.35), indicating underlying longer-term support, but has slipped just below its SMA-50 ($214.69), suggesting some medium-term resistance. The Ichimoku Kijun level sits at $204.77, which is below the current price and thus acts as immediate support. Momentum signals are mixed: MACD is neutral and ADX shows weak trend strength, while RSI remains in buying territory. Stoch RSI and CCI are both firmly overbought, suggesting the risk of a near-term cooldown. BBP indicates that buyer dominance is waning, and the current down day (down 4.09%, dropping $9.00) started with a minimal gap versus the previous close. The last trade is near the low of the session’s range, pointing to high intraday volatility and pressure from sellers after the open. Bullish readings from AO partially confirm longer-term optimism, but near-term oscillators caution against overexuberance, highlighting a clear divergence between short-term selling pressure and lingering bullish momentum.
Bullish bias remains as price eyes trading range boundaries
For the next week, the expected price range is $202.00 to $223.00. The probability of a price increase is high (more than 80%), making a decline less likely. In the baseline scenario, AMD could consolidate sideways, finding support near $204.77 and facing moderate resistance around $214.69. A bullish breakout would require reclaiming and holding above $215–$220, targeting retests of recent highs, while a bearish scenario would unfold if support near $202 is breached, increasing the risk of a deeper correction within a typical volatility band relative to current levels.
Earlier, analysts noted that AMD’s uptrend was propelled by strong buyer momentum despite emerging signs of potential overextension. The latest price action reinforces this cautious stance, as overbought oscillators and waning buyer strength heighten the risk of a near-term pullback if support near $204.77 fails to hold.


-
 Afghanistan
-
 Albania
-
 Algeria
-
 Angola
-
 Argentina
-
 Armenia
-
 Australia
-
 Austria
-
 Azerbaijan
-
 Bahamas
-
 Bahrain
-
 Bangladesh
-
 Belarus
-
 Belgium
-
 Bolivia
-
 Botswana
-
 Brazil
-
 Brunei
-
 Bulgaria
-
 Cambodia
-
 Cameroon
-
 Canada
-
 Chile
Chile
-
 China
China
-
 Colombia
-
 Congo
Congo
-
 Costa Rica
-
 Cote d'Ivoire
-
 Croatia
-
 Cuba
Cuba
-
 Cyprus
-
 Czechia
-
 DR Congo
-
 Denmark
-
 Dominican Republic
-
 Ecuador
-
 Egypt
Egypt
-
 El Salvador
-
 Estonia
-
 Eswatini
-
 Ethiopia
-
 Finland
-
 France
-
 Georgia
-
 Germany
-
 Ghana
Ghana
-
 Greece
-
 Haiti
Haiti
-
 Hong Kong
-
 Hungary
-
 India
India
-
 Indonesia
-
 Iran, Islamic republic
-
 Iraq
Iraq
-
 Ireland
-
 Israel
-
 Italy
Italy
-
 Jamaica
-
 Japan
Japan
-
 Jordan
-
 Kazakhstan
-
 Kenya
Kenya
-
 Korea
Korea
-
 Kuwait
-
 Kyrgyzstan
-
 Laos
Laos
-
 Latvia
-
 Lebanon
-
 Lesotho
-
 Libya
Libya
-
 Lithuania
-
 Luxembourg
-
 Madagascar
-
 Malaysia
-
 Malta
Malta
-
 Mauritius
-
 Mexico
-
 Moldova
-
 Mongolia
-
 Montenegro
-
 Morocco
-
 Mozambique
-
 Myanmar
-
 Namibia
-
 Nepal
Nepal
-
 Netherlands
-
 New Zealand
-
 Nigeria
-
 North Macedonia
-
 Norway
-
 Oman
Oman
-
 Pakistan
-
 Palestine
-
 Panama
-
 Papua New Guinea
-
 Paraguay
-
 Peru
Peru
-
 Philippines
-
 Poland
-
 Portugal
-
 Puerto Rico
-
 Qatar
Qatar
-
 Reunion
-
 Romania
-
 Rwanda
-
 Saudi Arabia
-
 Serbia
-
 Singapore
-
 Slovakia
-
 Slovenia
-
 Somalia
-
 South Africa
-
 Spain
Spain
-
 Sri Lanka
-
 Sweden
-
 Switzerland
-
 Syria
Syria
-
 Taiwan
-
 Tajikistan
-
 Tanzania
-
 Thailand
-
 Trinidad and Tobago
-
 Tunisia
-
 Turkey
-
 UAE
UAE
-
 Uganda
-
 Ukraine
-
 United Kingdom
-
United States
-
 Uruguay
-
 Uzbekistan
-
 Venezuela
-
 Vietnam
-
 Yemen
Yemen
-
 Zambia
-
 Zimbabwe
- Forex
- Crypto
