
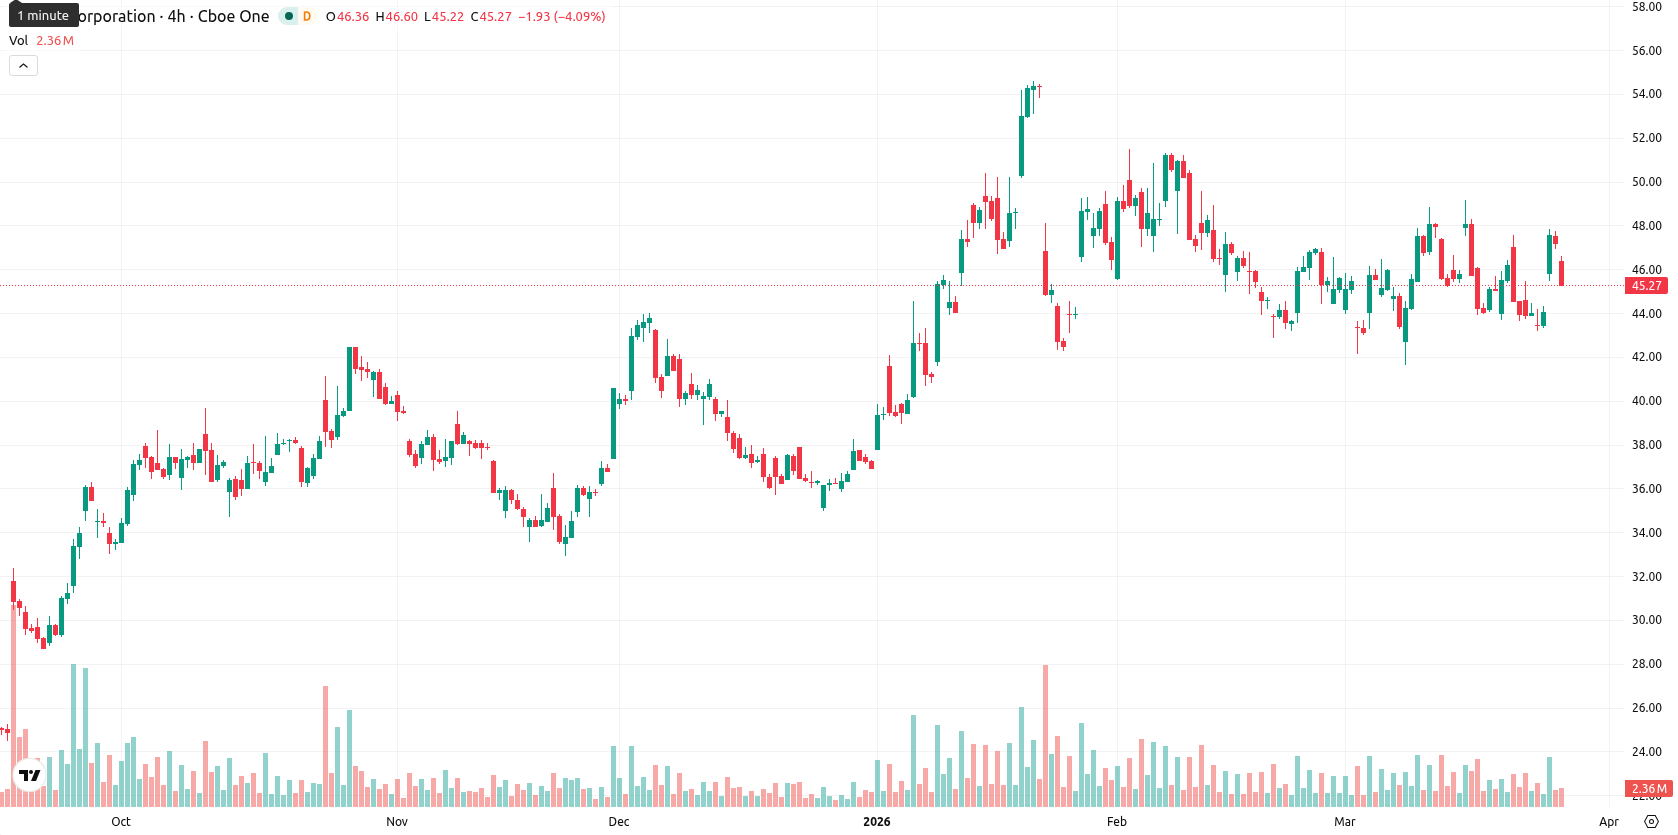
-4.59% for Intel stock as oscillators signal indecision and volatility spikes

Intel Corporation (INTC) is trading at $45.02, positioning just below the 20-day SMA of $45.31, beneath the 50-day SMA at $46.63, but well above the 200-day SMA at $34.56. This setup signals short-term pressure from sellers, a medium-term top-heavy structure, yet continued long-term bullish support; the Ichimoku Kijun at $45.41 now stands as immediate resistance.
Highlights
- Intel notified clients of substantial CPU price increases and began preliminary discussions with Apple about manufacturing low-end M-series chips.
- Despite expansion into AI offerings, institutional flows were mixed and Intel's share price remains under broad selling pressure.
- Technically, INTC trades below key short- and medium-term indicators, with significant volatility and a projected $44.00–$46.50 range as traders await breakout signals.
Institutional flows diverge amid price hikes and new chip initiatives
On March 25, 2026, Intel informed clients of double-digit price increases for its CPUs. The company was also reported to be in discussions with Apple about potential future production of low-end M-series chips. Intel is expanding its AI-related product offerings and partnerships, and changes in institutional positions occurred with the Czech National Bank increasing its holdings and Diversified Trust Co. reducing its stake, though price action has remained under broader selling pressure.
Volatility and mixed momentum as technical signals diverge intraday
Momentum inputs are mixed: D1 MACD flashes a strong sell, supported by neutral ADX at 8.76, suggesting little clear trend strength today. RSI reads 54.94 and signals buy, but D1 Stoch RSI and CCI are both in overbought territory, highlighting exhaustion among buyers. BBP at 2.53 confirms buyers have dominated intraday momentum, despite the price declining 4.59% so far; this drop opened with a slight gap down and has driven the price near today's low within a wide range, pointing to elevated volatility and persistent downward tone after the open. Divergent oscillator signals, with bullish RSI versus bearish oscillators, underline the indecision intraday and the absence of a unified momentum bias.
Upside risk persists as bullish signals outweigh near-term consolidation
For the coming week, price is expected to trade between $44.00 and $46.50, a volatility band relative to current levels. The probability of a further increase is high (more than 80%), while a decline is less likely, given that the majority of W1 trend indicators (MA-50, RSI, ADX, MACD) remain bullish. The baseline scenario envisions price consolidating sideways near current levels. In a bullish case, a break above $45.41 could trigger upside moves toward $46.50, while bearish momentum below $44.00 would expose a deeper retreat.
Previously it was reported that Intel was exhibiting a mix of short-term momentum weakness amid ongoing long-term bullish trends, with investors eyeing new product launches and institutional positioning for further direction. The latest developments—highlighted by pricing actions, evolving partnerships, and persistent volatility—underscore the importance of the $45.41 Ichimoku Kijun level as a pivotal resistance that could set the tone for the next move.


-
 Afghanistan
-
 Albania
-
 Algeria
-
 Angola
-
 Argentina
-
 Armenia
-
 Australia
-
 Austria
-
 Azerbaijan
-
 Bahamas
-
 Bahrain
-
 Bangladesh
-
 Belarus
-
 Belgium
-
 Bolivia
-
 Botswana
-
 Brazil
-
 Brunei
-
 Bulgaria
-
 Cambodia
-
 Cameroon
-
 Canada
-
 Chile
Chile
-
 China
China
-
 Colombia
-
 Congo
Congo
-
 Costa Rica
-
 Cote d'Ivoire
-
 Croatia
-
 Cuba
Cuba
-
 Cyprus
-
 Czechia
-
 DR Congo
-
 Denmark
-
 Dominican Republic
-
 Ecuador
-
 Egypt
Egypt
-
 El Salvador
-
 Estonia
-
 Eswatini
-
 Ethiopia
-
 Finland
-
 France
-
 Georgia
-
 Germany
-
 Ghana
Ghana
-
 Greece
-
 Haiti
Haiti
-
 Hong Kong
-
 Hungary
-
 India
India
-
 Indonesia
-
 Iran, Islamic republic
-
 Iraq
Iraq
-
 Ireland
-
 Israel
-
 Italy
Italy
-
 Jamaica
-
 Japan
Japan
-
 Jordan
-
 Kazakhstan
-
 Kenya
Kenya
-
 Korea
Korea
-
 Kuwait
-
 Kyrgyzstan
-
 Laos
Laos
-
 Latvia
-
 Lebanon
-
 Lesotho
-
 Libya
Libya
-
 Lithuania
-
 Luxembourg
-
 Madagascar
-
 Malaysia
-
 Malta
Malta
-
 Mauritius
-
 Mexico
-
 Moldova
-
 Mongolia
-
 Montenegro
-
 Morocco
-
 Mozambique
-
 Myanmar
-
 Namibia
-
 Nepal
Nepal
-
 Netherlands
-
 New Zealand
-
 Nigeria
-
 North Macedonia
-
 Norway
-
 Oman
Oman
-
 Pakistan
-
 Palestine
-
 Panama
-
 Papua New Guinea
-
 Paraguay
-
 Peru
Peru
-
 Philippines
-
 Poland
-
 Portugal
-
 Puerto Rico
-
 Qatar
Qatar
-
 Reunion
-
 Romania
-
 Rwanda
-
 Saudi Arabia
-
 Serbia
-
 Singapore
-
 Slovakia
-
 Slovenia
-
 Somalia
-
 South Africa
-
 Spain
Spain
-
 Sri Lanka
-
 Sweden
-
 Switzerland
-
 Syria
Syria
-
 Taiwan
-
 Tajikistan
-
 Tanzania
-
 Thailand
-
 Trinidad and Tobago
-
 Tunisia
-
 Turkey
-
 UAE
UAE
-
 Uganda
-
 Ukraine
-
 United Kingdom
-
United States
-
 Uruguay
-
 Uzbekistan
-
 Venezuela
-
 Vietnam
-
 Yemen
Yemen
-
 Zambia
-
 Zimbabwe
- Forex
- Crypto
