
Bit Digital stock price forecast: Downside risk increases as BTBT loses 7.55%

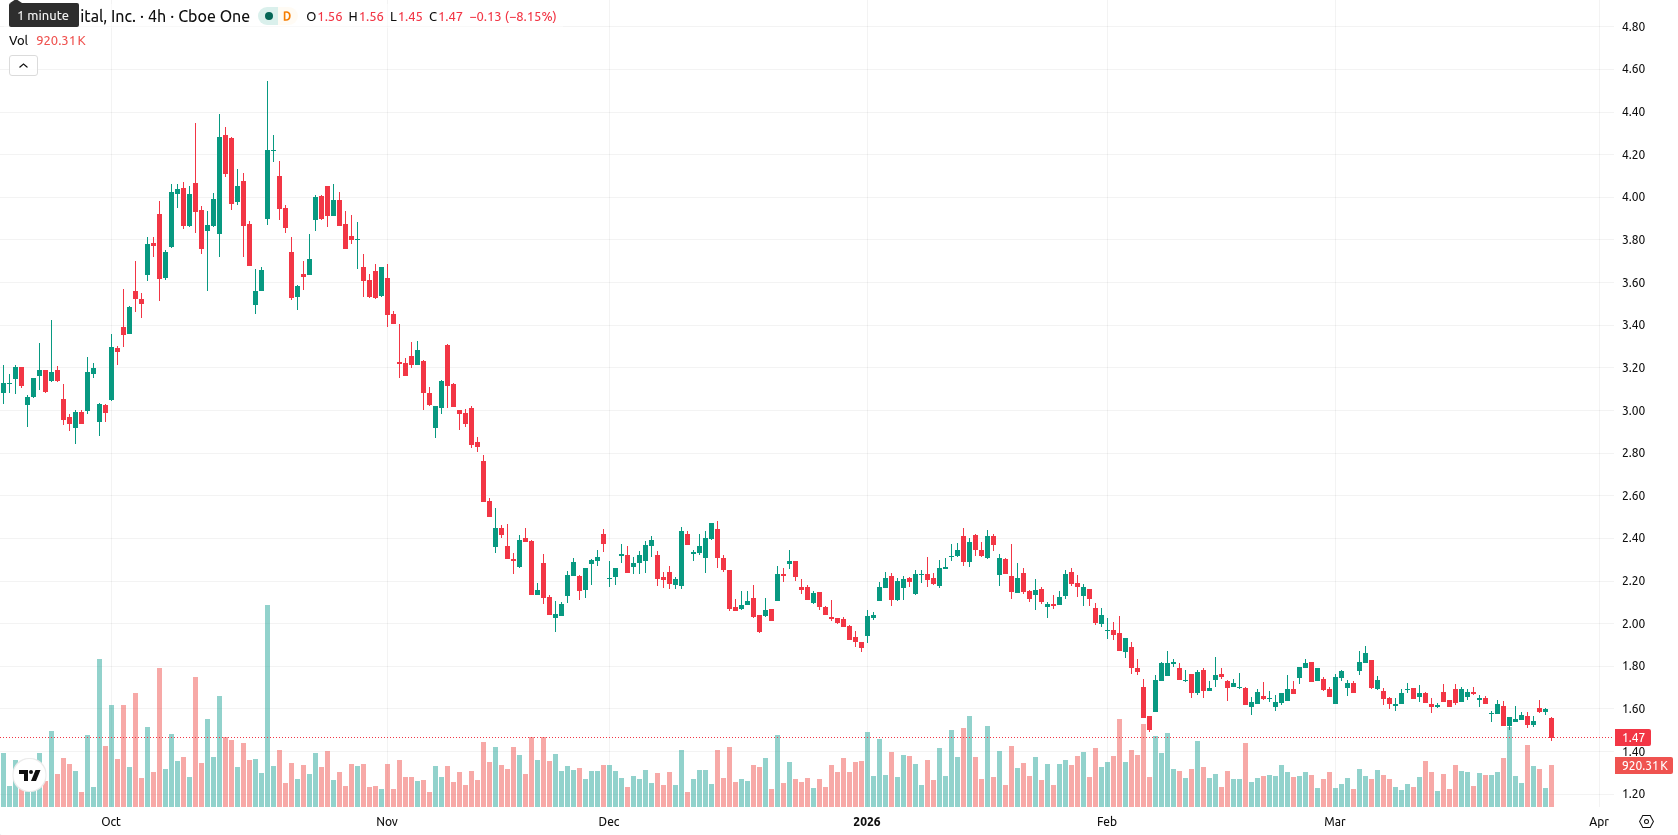
Bit Digital Inc (BTBT) is trading at $1.47, which is below the SMA-20 ($1.66), SMA-50 ($1.83), and SMA-200 ($2.61), indicating persistent downward pressure in the short, medium, and long term. The Ichimoku Kijun level is at $1.70, acting as immediate resistance for any potential rebound.
Highlights
- BTBT remains in a sustained downtrend, trading below key moving averages in the short, medium, and long term.
- Momentum signals are bearish overall despite some oscillators flashing short-term buy signals, indicating unstable market sentiment.
- The price is expected to consolidate between $1.40 and $1.60 over the next five days, with $1.70 as immediate resistance and elevated risk of further declines.
Bearish momentum persists as technical oscillators show conflicting signals
Momentum signals remain weak, as the MACD gives a strong sell signal and the ADX is neutral, signaling a lack of strong trend direction. The RSI (43.20) and CCI (–73.23) are both in the sell territory, highlighting continued bearish momentum, yet the Stoch RSI indicates a strong buy, suggesting short-term oversold conditions. BBP is barely positive, but its forecast is "Buy," hinting at waning seller dominance, although AO is neutral and does not reinforce the current price trend. On the session, BTBT slipped 7.55% to $1.47, opening just below the previous close ($1.55 vs $1.59), so there was no significant gap; the current price is near today’s low in a narrow intraday range ($1.45 – $1.55) with low volatility and steady pressure after the open. The divergence between oscillator buy signals (Stoch RSI, BBP, HMA) and broader momentum/MA weakness points to an unstable bearish tone for now.
Sideways consolidation favored as sell signals outweigh upside risk
Looking ahead, the expected price range for the next five trading days is $1.40 – $1.60, normalized to stay within a typical volatility band relative to current levels. There is a very low probability (less than 20%) of a sustained price increase, while a further decline remains more likely as confirmed by persistent weekly and daily sell signals on the MA, RSI, and MACD. Baseline scenario: price consolidates in a sideways corridor between $1.40 and $1.60. Bullish scenario: a break above $1.70 (immediate resistance) could trigger a short-term bounce toward $1.60 – $1.70. Bearish scenario: a break below $1.45 support opens the way to retest lower levels near $1.40.
Earlier, analysts noted that Bit Digital faced ongoing bearish momentum with little evidence of a reversal taking shape. The latest technical signals reinforce this negative bias, making a potential breakdown below $1.45 the critical level for traders to monitor in the coming sessions.


Latest Bit Digital News


-
 Afghanistan
-
 Albania
-
 Algeria
-
 Angola
-
 Argentina
-
 Armenia
-
 Australia
-
 Austria
-
 Azerbaijan
-
 Bahamas
-
 Bahrain
-
 Bangladesh
-
 Belarus
-
 Belgium
-
 Bolivia
-
 Botswana
-
 Brazil
-
 Brunei
-
 Bulgaria
-
 Cambodia
-
 Cameroon
-
 Canada
-
 Chile
Chile
-
 China
China
-
 Colombia
-
 Congo
Congo
-
 Costa Rica
-
 Cote d'Ivoire
-
 Croatia
-
 Cuba
Cuba
-
 Cyprus
-
 Czechia
-
 DR Congo
-
 Denmark
-
 Dominican Republic
-
 Ecuador
-
 Egypt
Egypt
-
 El Salvador
-
 Estonia
-
 Eswatini
-
 Ethiopia
-
 Finland
-
 France
-
 Georgia
-
 Germany
-
 Ghana
Ghana
-
 Greece
-
 Haiti
Haiti
-
 Hong Kong
-
 Hungary
-
 India
India
-
 Indonesia
-
 Iran, Islamic republic
-
 Iraq
Iraq
-
 Ireland
-
 Israel
-
 Italy
Italy
-
 Jamaica
-
 Japan
Japan
-
 Jordan
-
 Kazakhstan
-
 Kenya
Kenya
-
 Korea
Korea
-
 Kuwait
-
 Kyrgyzstan
-
 Laos
Laos
-
 Latvia
-
 Lebanon
-
 Lesotho
-
 Libya
Libya
-
 Lithuania
-
 Luxembourg
-
 Madagascar
-
 Malaysia
-
 Malta
Malta
-
 Mauritius
-
 Mexico
-
 Moldova
-
 Mongolia
-
 Montenegro
-
 Morocco
-
 Mozambique
-
 Myanmar
-
 Namibia
-
 Nepal
Nepal
-
 Netherlands
-
 New Zealand
-
 Nigeria
-
 North Macedonia
-
 Norway
-
 Oman
Oman
-
 Pakistan
-
 Palestine
-
 Panama
-
 Papua New Guinea
-
 Paraguay
-
 Peru
Peru
-
 Philippines
-
 Poland
-
 Portugal
-
 Puerto Rico
-
 Qatar
Qatar
-
 Reunion
-
 Romania
-
 Rwanda
-
 Saudi Arabia
-
 Serbia
-
 Singapore
-
 Slovakia
-
 Slovenia
-
 Somalia
-
 South Africa
-
 Spain
Spain
-
 Sri Lanka
-
 Sweden
-
 Switzerland
-
 Syria
Syria
-
 Taiwan
-
 Tajikistan
-
 Tanzania
-
 Thailand
-
 Trinidad and Tobago
-
 Tunisia
-
 Turkey
-
 UAE
UAE
-
 Uganda
-
 Ukraine
-
 United Kingdom
-
United States
-
 Uruguay
-
 Uzbekistan
-
 Venezuela
-
 Vietnam
-
 Yemen
Yemen
-
 Zambia
-
 Zimbabwe
- Forex
- Crypto
