
-3.64% for Robinhood stock as technicals show firm downtrend and oversold signals

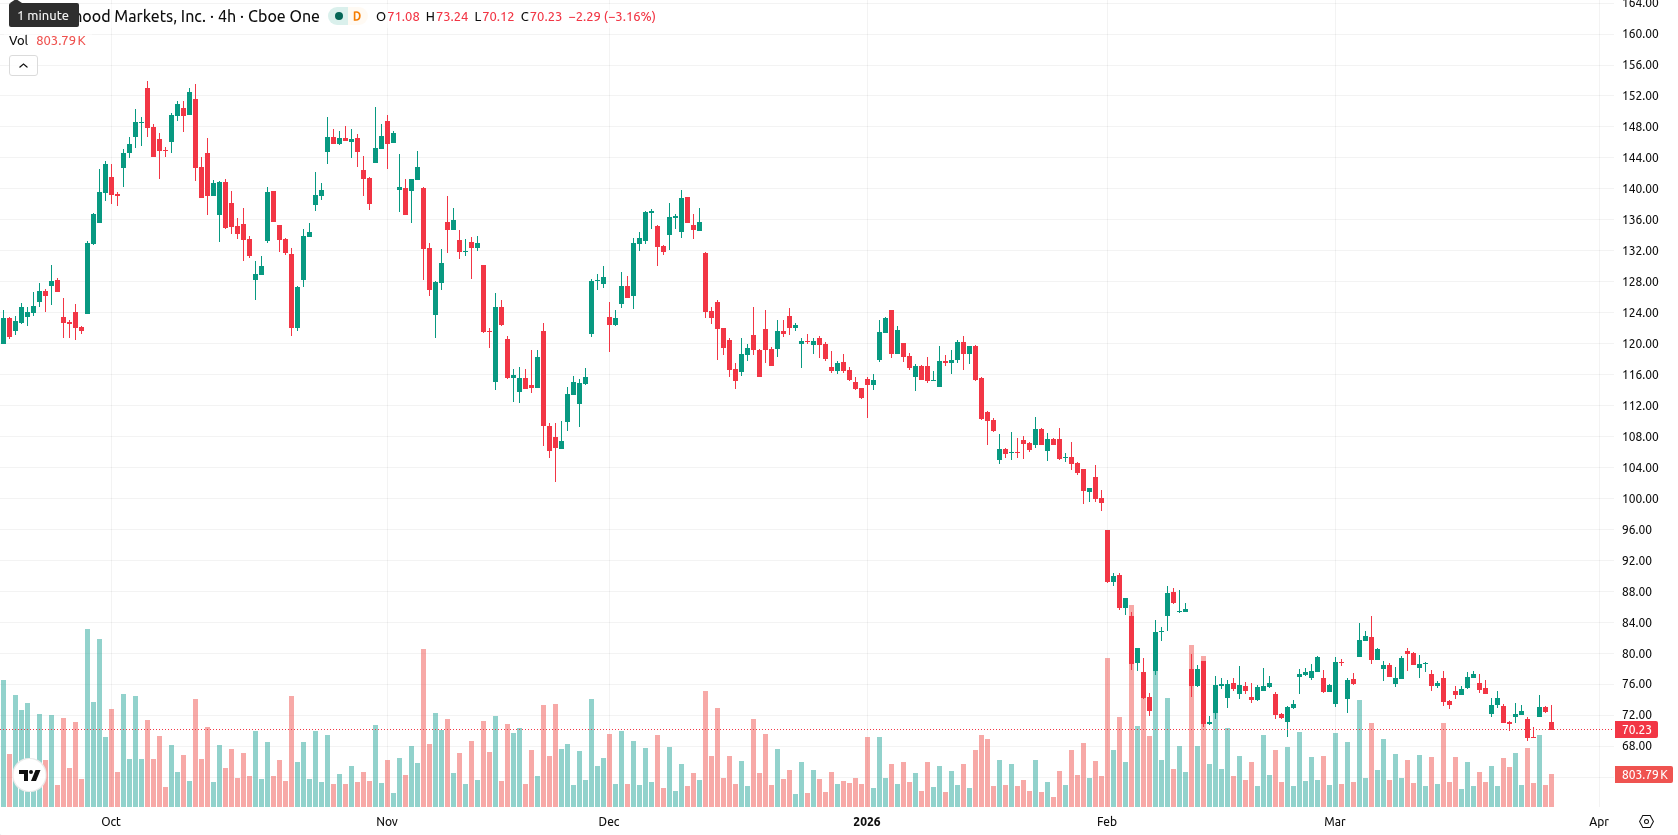
Robinhood Markets Inc (HOOD) is trading at $69.90 after a 3.64% daily decline, remaining well below its SMA-20 ($76.14), SMA-50 ($85.17), and SMA-200 ($107.82), which all point to strong selling pressure across short, medium, and long timeframes. The Ichimoku Kijun at $76.66 serves as the nearest resistance just above the current price.
Highlights
- Robinhood's board authorized a $1.5 billion share buyback program spread over three years, expanding capital return efforts.
- The company secured a $3.25 billion revolving credit facility with JPMorgan Chase, replacing its previous $2.65 billion line.
- Robinhood trades under persistent selling pressure below key technical levels, with momentum indicators signaling a bearish outlook and a likely range of $67.00 to $72.50 in the near term.
Expanded buybacks and new credit line amid continued share pressure
On March 24, 2026, Robinhood's Board of Directors approved a new $1.5 billion share repurchase program to be executed over the next three years, adding $1.1 billion in new authorization to its existing capital return efforts. The company also established a $3.25 billion revolving credit facility with JPMorgan Chase, replacing its prior $2.65 billion line, though price action has remained under broader selling pressure.
Downtrend intensifies with widespread technical weakness and volatile gap down
Technical analysis shows that HOOD is trading below key moving averages with the SMA-20 at $76.14, the SMA-50 at $85.17, and the SMA-200 at $107.82, underscoring pronounced downtrends in all timeframes. Immediate resistance is indicated by the Ichimoku Kijun at $76.66. Momentum indicators are strongly negative: MACD gives a strong sell signal, ADX reflects firm bearish momentum, and oversold conditions are confirmed by an RSI of 42.39, CCI at -83.31, and BBP readings. Stoch RSI and HMA both signal "Strong Buy," but overall oscillator signals point to continued weakness, with the Awesome Oscillator affirming the downtrend. Today's session began with a gap down from $72.54 to $71.33, and the closing price near the day's low highlights persistent selling pressure along with heightened intraday volatility.
Limited rebound prospects as range-bound trading signals downside risk
Over the next five trading days, HOOD is expected to fluctuate within a volatility band of $67.00 to $72.50. With no weekly buy signals present in RSI, ADX, MACD, or the MA-50, the probability of a rebound is very low (below 20%), suggesting further downside risk. The baseline scenario forecasts sideways movement between established support and resistance levels. A bullish shift would require a breakout above resistance at $76.66, while a bearish scenario may develop if the price falls below the recent support near $67.00.
Earlier, analysts noted that Robinhood was experiencing pronounced bearish momentum despite corporate buyback efforts. The latest technical signals reinforce this negative outlook, with traders advised to monitor the $67.00 support level for indications of further downside risk in the near term.


Latest Robinhood News


-
 Afghanistan
-
 Albania
-
 Algeria
-
 Angola
-
 Argentina
-
 Armenia
-
 Australia
-
 Austria
-
 Azerbaijan
-
 Bahamas
-
 Bahrain
-
 Bangladesh
-
 Belarus
-
 Belgium
-
 Bolivia
-
 Botswana
-
 Brazil
-
 Brunei
-
 Bulgaria
-
 Cambodia
-
 Cameroon
-
 Canada
-
 Chile
Chile
-
 China
China
-
 Colombia
-
 Congo
Congo
-
 Costa Rica
-
 Cote d'Ivoire
-
 Croatia
-
 Cuba
Cuba
-
 Cyprus
-
 Czechia
-
 DR Congo
-
 Denmark
-
 Dominican Republic
-
 Ecuador
-
 Egypt
Egypt
-
 El Salvador
-
 Estonia
-
 Eswatini
-
 Ethiopia
-
 Finland
-
 France
-
 Georgia
-
 Germany
-
 Ghana
Ghana
-
 Greece
-
 Haiti
Haiti
-
 Hong Kong
-
 Hungary
-
 India
India
-
 Indonesia
-
 Iran, Islamic republic
-
 Iraq
Iraq
-
 Ireland
-
 Israel
-
 Italy
Italy
-
 Jamaica
-
 Japan
Japan
-
 Jordan
-
 Kazakhstan
-
 Kenya
Kenya
-
 Korea
Korea
-
 Kuwait
-
 Kyrgyzstan
-
 Laos
Laos
-
 Latvia
-
 Lebanon
-
 Lesotho
-
 Libya
Libya
-
 Lithuania
-
 Luxembourg
-
 Madagascar
-
 Malaysia
-
 Malta
Malta
-
 Mauritius
-
 Mexico
-
 Moldova
-
 Mongolia
-
 Montenegro
-
 Morocco
-
 Mozambique
-
 Myanmar
-
 Namibia
-
 Nepal
Nepal
-
 Netherlands
-
 New Zealand
-
 Nigeria
-
 North Macedonia
-
 Norway
-
 Oman
Oman
-
 Pakistan
-
 Palestine
-
 Panama
-
 Papua New Guinea
-
 Paraguay
-
 Peru
Peru
-
 Philippines
-
 Poland
-
 Portugal
-
 Puerto Rico
-
 Qatar
Qatar
-
 Reunion
-
 Romania
-
 Rwanda
-
 Saudi Arabia
-
 Serbia
-
 Singapore
-
 Slovakia
-
 Slovenia
-
 Somalia
-
 South Africa
-
 Spain
Spain
-
 Sri Lanka
-
 Sweden
-
 Switzerland
-
 Syria
Syria
-
 Taiwan
-
 Tajikistan
-
 Tanzania
-
 Thailand
-
 Trinidad and Tobago
-
 Tunisia
-
 Turkey
-
 UAE
UAE
-
 Uganda
-
 Ukraine
-
 United Kingdom
-
United States
-
 Uruguay
-
 Uzbekistan
-
 Venezuela
-
 Vietnam
-
 Yemen
Yemen
-
 Zambia
-
 Zimbabwe
- Forex
- Crypto
