
AST SpaceMobile stock slides after Q4 revenue beats estimates but volatility persists

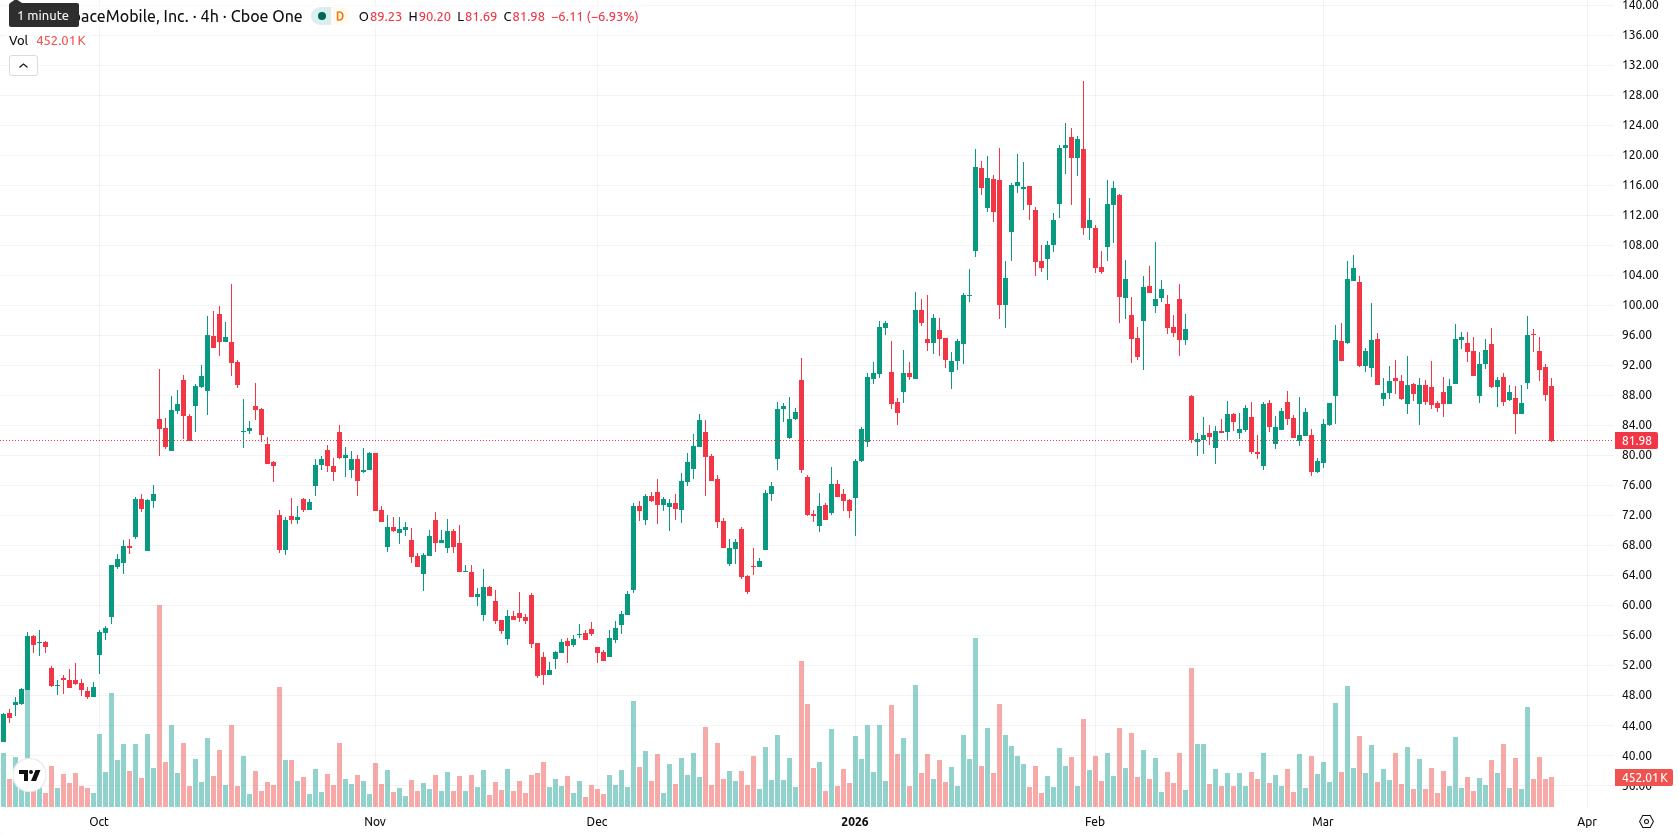
AST SpaceMobile (ASTS) is trading at $82.02, down 6.65% on the day and positioned well below its SMA-20 ($90.24) and SMA-50 ($95.69), but above its SMA-200 ($68.97). This configuration suggests persistent short- and medium-term downside pressure with support from the longer-term trend; the Ichimoku Kijun at $91.93 establishes immediate resistance.
Highlights
- AST SpaceMobile outperformed expectations with $70.9 million in fiscal year 2025 revenue, primarily from late-year prepayments and service activations.
- The company achieved direct-to-device service profitability and transitioned to operational status following the successful BlueBird 7 satellite launch.
- Technicals signal strong short- and medium-term downside, with high volatility keeping price likely bounded between $74.00 and $89.00 near term.
Revenue beat and satellite milestone contrast with ongoing selloff
AST SpaceMobile reported fiscal year 2025 revenue of $70.9 million, significantly above consensus, with most of the revenue generated from prepayments and service activations in the fourth quarter. The company achieved a pivotal milestone as its direct-to-device satellite service turned profitable, and completed the successful launch of the BlueBird 7 satellite in March, marking its transition from development-stage to operational status. AT&T activated a fourth satellite ground gateway to expand coverage, though price action has remained under broader selling pressure.
Strong sell signals as volatility and indicator divergence increase
Technical momentum for ASTS is negative, as the MACD signals a strong sell and ADX points to a weak trend on the daily timeframe. The RSI sits at 47.74 and CCI at –5.31, both leaning bearish, with the Stoch RSI at 14.87 highlighting pronounced oversold conditions; BBP indicates that sellers dominate intraday. While the price gapped higher at the open, it has since reversed sharply, declining 6.65% from the previous close and trading near the day’s low ($83.11) amid high volatility and ongoing downside pressure. The Awesome Oscillator is diverging from other signals, underlining some indicator disagreement.
Further declines likely as upward breakout odds remain limited
Looking into the coming week, typical volatility is likely to keep ASTS trading between $74.00 and $89.00. The probability of an upward breakout is low (less than 20%), so further downside is the most likely outcome. The base expectation is for price to oscillate within this corridor, reflecting short-term uncertainty. A sustained move above $91.93 would signal a reversal, while a breakdown below $74.00 could open up deeper support levels, despite longer-term trends remaining constructive.
Earlier, analysts noted that AST SpaceMobile maintained a generally bullish technical structure despite sector volatility and mixed momentum indicators. The recent break below short- and medium-term moving averages introduces a shift in tone, with traders now watching for a decisive move above $91.93 or a deeper slide below $74.00 to determine the next direction.


Latest AST SpaceMobile News


-
 Afghanistan
-
 Albania
-
 Algeria
-
 Angola
-
 Argentina
-
 Armenia
-
 Australia
-
 Austria
-
 Azerbaijan
-
 Bahamas
-
 Bahrain
-
 Bangladesh
-
 Belarus
-
 Belgium
-
 Bolivia
-
 Botswana
-
 Brazil
-
 Brunei
-
 Bulgaria
-
 Cambodia
-
 Cameroon
-
 Canada
-
 Chile
Chile
-
 China
China
-
 Colombia
-
 Congo
Congo
-
 Costa Rica
-
 Cote d'Ivoire
-
 Croatia
-
 Cuba
Cuba
-
 Cyprus
-
 Czechia
-
 DR Congo
-
 Denmark
-
 Dominican Republic
-
 Ecuador
-
 Egypt
Egypt
-
 El Salvador
-
 Estonia
-
 Eswatini
-
 Ethiopia
-
 Finland
-
 France
-
 Georgia
-
 Germany
-
 Ghana
Ghana
-
 Greece
-
 Haiti
Haiti
-
 Hong Kong
-
 Hungary
-
 India
India
-
 Indonesia
-
 Iran, Islamic republic
-
 Iraq
Iraq
-
 Ireland
-
 Israel
-
 Italy
Italy
-
 Jamaica
-
 Japan
Japan
-
 Jordan
-
 Kazakhstan
-
 Kenya
Kenya
-
 Korea
Korea
-
 Kuwait
-
 Kyrgyzstan
-
 Laos
Laos
-
 Latvia
-
 Lebanon
-
 Lesotho
-
 Libya
Libya
-
 Lithuania
-
 Luxembourg
-
 Madagascar
-
 Malaysia
-
 Malta
Malta
-
 Mauritius
-
 Mexico
-
 Moldova
-
 Mongolia
-
 Montenegro
-
 Morocco
-
 Mozambique
-
 Myanmar
-
 Namibia
-
 Nepal
Nepal
-
 Netherlands
-
 New Zealand
-
 Nigeria
-
 North Macedonia
-
 Norway
-
 Oman
Oman
-
 Pakistan
-
 Palestine
-
 Panama
-
 Papua New Guinea
-
 Paraguay
-
 Peru
Peru
-
 Philippines
-
 Poland
-
 Portugal
-
 Puerto Rico
-
 Qatar
Qatar
-
 Reunion
-
 Romania
-
 Rwanda
-
 Saudi Arabia
-
 Serbia
-
 Singapore
-
 Slovakia
-
 Slovenia
-
 Somalia
-
 South Africa
-
 Spain
Spain
-
 Sri Lanka
-
 Sweden
-
 Switzerland
-
 Syria
Syria
-
 Taiwan
-
 Tajikistan
-
 Tanzania
-
 Thailand
-
 Trinidad and Tobago
-
 Tunisia
-
 Turkey
-
 UAE
UAE
-
 Uganda
-
 Ukraine
-
 United Kingdom
-
United States
-
 Uruguay
-
 Uzbekistan
-
 Venezuela
-
 Vietnam
-
 Yemen
Yemen
-
 Zambia
-
 Zimbabwe
- Forex
- Crypto
