
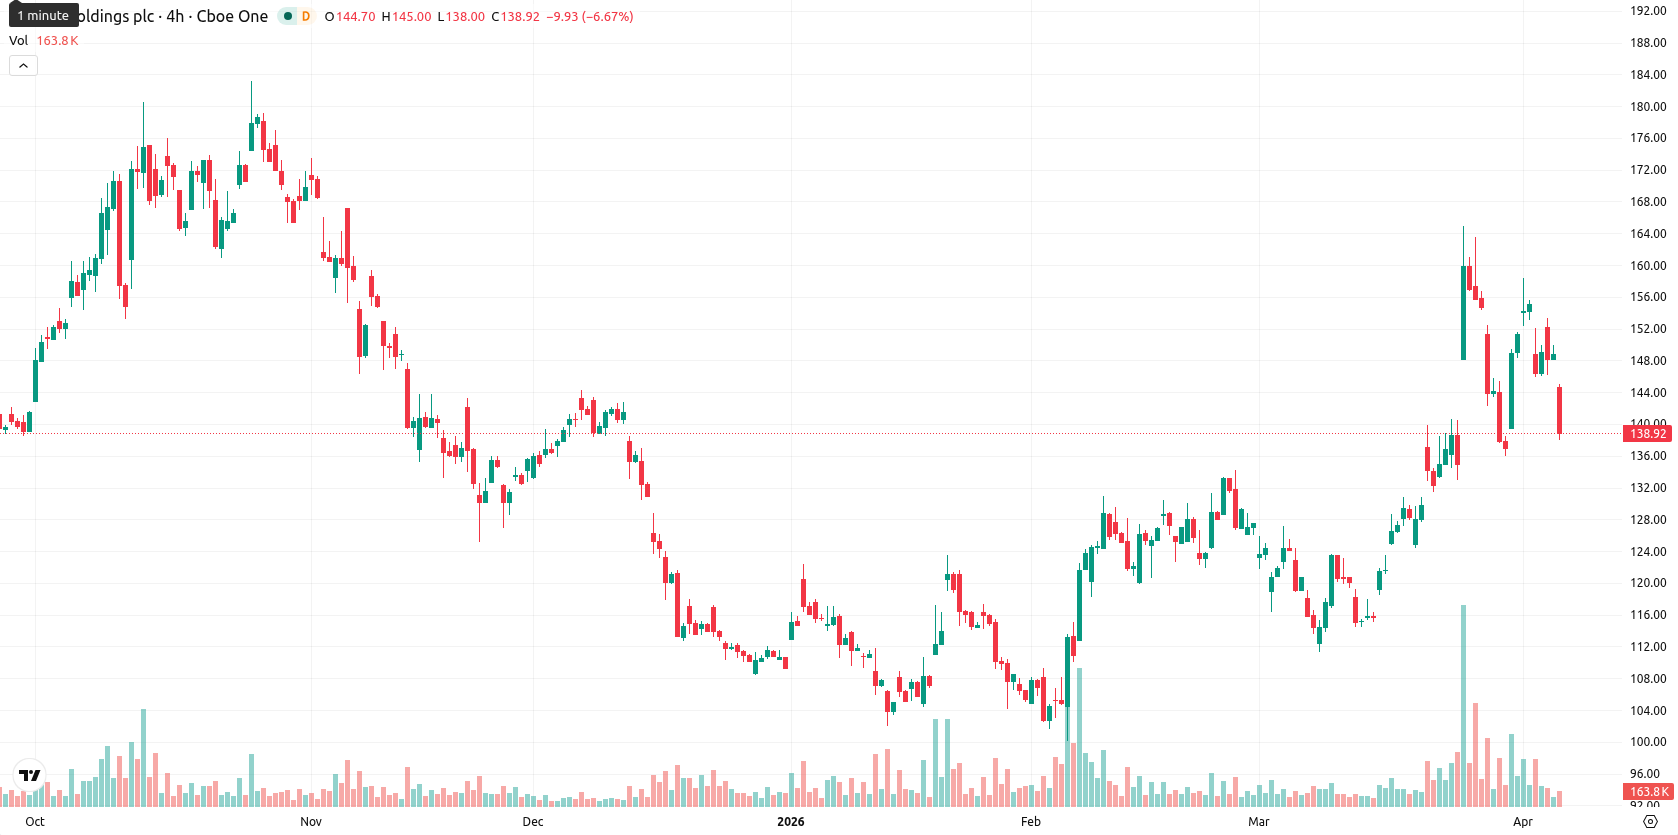
Arm Holdings stock falls 6.19% as price sinks toward session lows

Arm Holdings (ARM) is trading at $139.56 after a steep daily drop of 6.19%. The current price remains above the SMA-20 ($134.89) and SMA-50 ($125.87), and it is just above the SMA-200 ($138.61), signaling ongoing short- and medium-term upward momentum while testing long-term support.
Highlights
- ARM trades with short- and medium-term upward momentum but faces immediate resistance after a sharp intraday decline.
- Momentum indicators are mixed, with recent buyer dominance offset by signs of overbought conditions and weak overall trend strength.
- ARM is likely to consolidate between $136.00 and $144.50 over the next five days, with potential for further gains if $144.50 breaks or downside if $136.00 fails.
Mixed momentum with resistance and volatility signaling caution
Technical analysis indicates that the D1 Ichimoku Kijun at $138.98 is positioned just above the present price and serves as immediate resistance. Momentum signals are mixed: the D1 MACD remains positive, but ADX is low, suggesting upside momentum with limited overall trend strength. RSI and CCI are in buy territory but not overbought, while Stoch RSI is neutral, and BBP signals overbought conditions, pointing to recent buyer dominance and potential exhaustion. High intraday volatility is evident, with the session opening lower (gap down from $148.77 to $143.82) and the price near session lows, indicating persistent selling pressure after the open; the divergence between oscillators and momentum tools, combined with BBP's shift to overbought, warrants short-term caution as intraday weakness contrasts with prior bullish momentum.
Consolidation favored as volatility contains directional risk
ARM is expected to trade within a typical volatility band between $136.00 and $144.50 over the next five trading days. The probability of a price increase is moderate, and a daily close below support is less likely. The baseline scenario is consolidation near current levels. A break above $144.50 could allow further gains toward prior resistance, whereas a break below $136.00 may trigger additional downside with sellers potentially regaining control.
Previously it was reported that Arm Holdings maintained a broadly bullish technical setup, supported by ongoing strategic initiatives and resilient overall momentum. The latest sharp pullback signals a test of long-term support and introduces short-term caution, making sustained closes above the 200-day moving average a key level for directional bias in the days ahead.


Latest Arm News


-
 Afghanistan
-
 Albania
-
 Algeria
-
 Angola
-
 Argentina
-
 Armenia
-
 Australia
-
 Austria
-
 Azerbaijan
-
 Bahamas
-
 Bahrain
-
 Bangladesh
-
 Belarus
-
 Belgium
-
 Bolivia
-
 Botswana
-
 Brazil
-
 Brunei
-
 Bulgaria
-
 Cambodia
-
 Cameroon
-
 Canada
-
 Chile
Chile
-
 China
China
-
 Colombia
-
 Congo
Congo
-
 Costa Rica
-
 Cote d'Ivoire
-
 Croatia
-
 Cuba
Cuba
-
 Cyprus
-
 Czechia
-
 DR Congo
-
 Denmark
-
 Dominican Republic
-
 Ecuador
-
 Egypt
Egypt
-
 El Salvador
-
 Estonia
-
 Eswatini
-
 Ethiopia
-
 Finland
-
 France
-
 Georgia
-
 Germany
-
 Ghana
Ghana
-
 Greece
-
 Haiti
Haiti
-
 Hong Kong
-
 Hungary
-
 India
India
-
 Indonesia
-
 Iran, Islamic republic
-
 Iraq
Iraq
-
 Ireland
-
 Israel
-
 Italy
Italy
-
 Jamaica
-
 Japan
Japan
-
 Jordan
-
 Kazakhstan
-
 Kenya
Kenya
-
 Korea
Korea
-
 Kuwait
-
 Kyrgyzstan
-
 Laos
Laos
-
 Latvia
-
 Lebanon
-
 Lesotho
-
 Libya
Libya
-
 Lithuania
-
 Luxembourg
-
 Madagascar
-
 Malaysia
-
 Malta
Malta
-
 Mauritius
-
 Mexico
-
 Moldova
-
 Mongolia
-
 Montenegro
-
 Morocco
-
 Mozambique
-
 Myanmar
-
 Namibia
-
 Nepal
Nepal
-
 Netherlands
-
 New Zealand
-
 Nigeria
-
 North Macedonia
-
 Norway
-
 Oman
Oman
-
 Pakistan
-
 Palestine
-
 Panama
-
 Papua New Guinea
-
 Paraguay
-
 Peru
Peru
-
 Philippines
-
 Poland
-
 Portugal
-
 Puerto Rico
-
 Qatar
Qatar
-
 Reunion
-
 Romania
-
 Rwanda
-
 Saudi Arabia
-
 Serbia
-
 Singapore
-
 Slovakia
-
 Slovenia
-
 Somalia
-
 South Africa
-
 Spain
Spain
-
 Sri Lanka
-
 Sweden
-
 Switzerland
-
 Syria
Syria
-
 Taiwan
-
 Tajikistan
-
 Tanzania
-
 Thailand
-
 Trinidad and Tobago
-
 Tunisia
-
 Turkey
-
 UAE
UAE
-
 Uganda
-
 Ukraine
-
 United Kingdom
-
United States
-
 Uruguay
-
 Uzbekistan
-
 Venezuela
-
 Vietnam
-
 Yemen
Yemen
-
 Zambia
-
 Zimbabwe
- Forex
- Crypto
