
Nvidia stock price forecast: $180.97 resistance as NVDA gains 1.61%

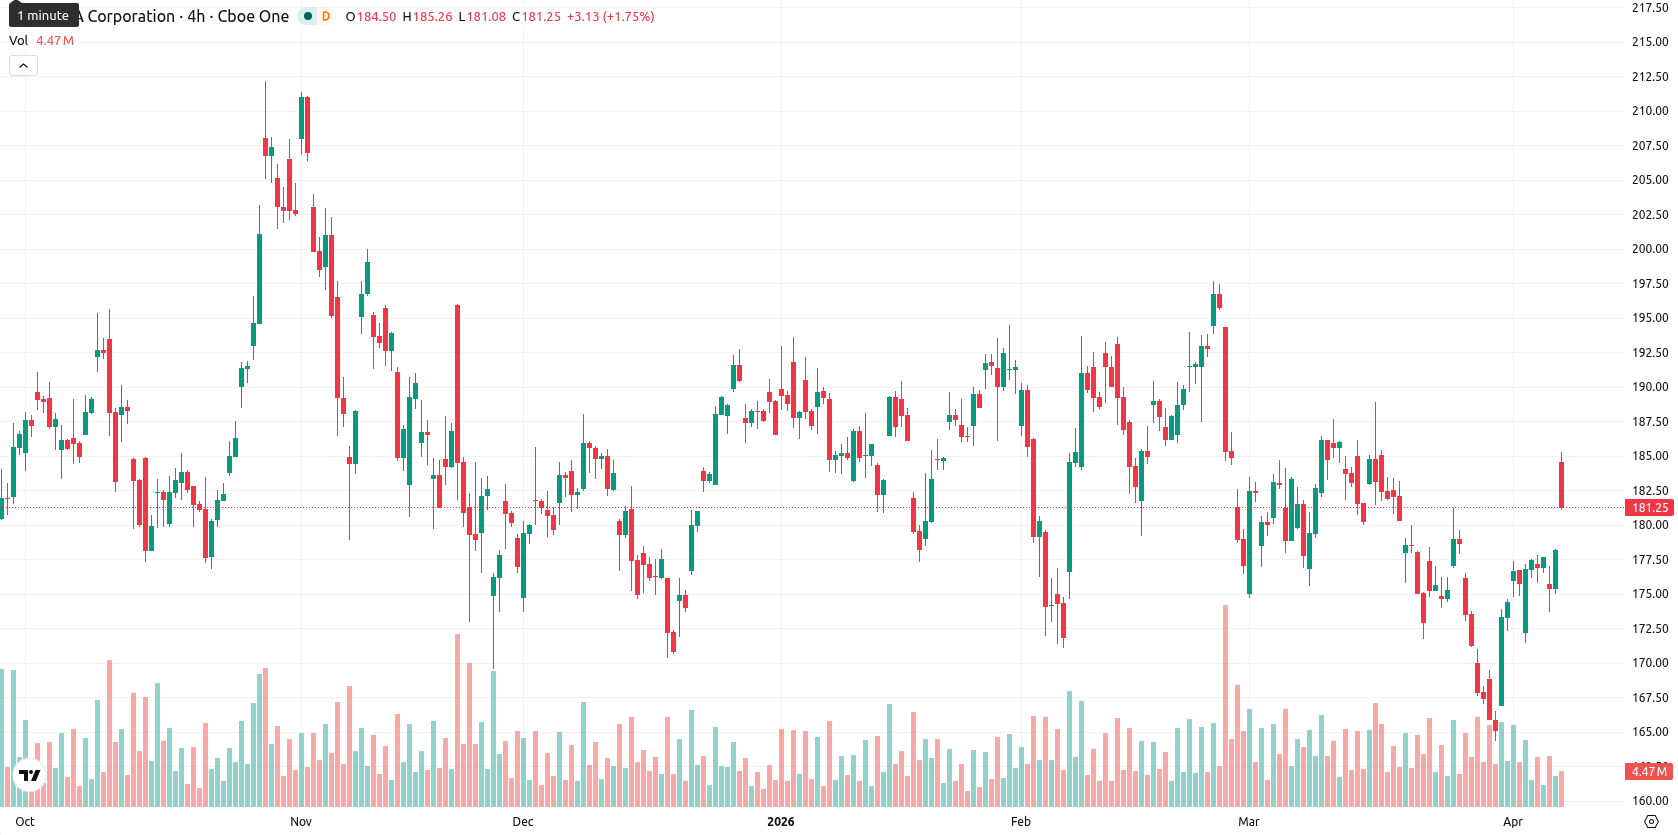
Nvidia Corporation (NVDA) is trading at $180.80, up 1.61% on the day. The current price sits above the MA-20 ($177.40) but is just below the MA-50 ($182.32) and nearly at the MA-200 ($180.14), reflecting near-term buying interest despite medium-term resistance and lingering long-term support.
Highlights
- Nvidia posted $68.13 billion in quarterly revenue, up 73.2% year-over-year, beating estimates and reflecting strong AI demand.
- Institutional ownership stands at 65.27%, but notable insider selling totaled $253 million over the past three months.
- Nvidia trades in a narrow range with momentum mixed; odds favor consolidation or mild decline unless price decisively breaks above $180.97.
Stronger revenue and insider selling as institutional positioning shifts
Nvidia reported $68.13 billion in quarterly revenue, a 73.2% year-over-year increase that surpassed expectations, with earnings per share at $1.62. The company completed its acquisition of SchedMD in December 2025, integrating Slurm's open-source cluster scheduling platform to enhance AI workload management. Over the past three months, significant insider selling reached about $253 million, and institutional investors and hedge funds currently hold 65.27% of NVDA shares, with recent position shifts also noted. Donaldson Capital Management increased its Nvidia holdings by 5.5% in Q4.
Overbought intraday momentum contrasts with weak trend and bearish MACD
Momentum indicators present a mixed picture for NVDA: the MACD on the daily chart signals strong selling pressure, while the ADX remains weak at 16.97, indicating a lack of clear market direction. RSI is neutral at 49.71, but a Stoch RSI reading of 100 and BBP above 2.00 suggest some overbought conditions with buyers dominating intraday momentum. Today’s session opened with an upward gap, and the price now trades mid-range amid moderate volatility and early strength fading into sideways consolidation. The divergence between overbought oscillators, weak ADX, and seller-biased MACD warrants caution despite a positive daily move; the Ichimoku Kijun level at $176.58 offers underlying support.
Limited upside seen as probabilities favor consolidation over breakout
For the week ahead, NVDA is likely to trade within a typical volatility band of $178.85 to $180.97. The calculated probability of a price increase remains low (less than 20%), indicating a higher likelihood of further declines and a base scenario of consolidation inside this narrow range. A bullish outcome would require a breakout above $180.97 and sustained strength above resistance, while a fall below $178.85 could signal additional downside, as oscillators and weekly RSI indicate limited room for upside.
Earlier, analysts noted that Nvidia faced persistent selling pressure and heightened uncertainty stemming from geopolitical risks and intensifying competition. The latest technical and fundamental signals reinforce a cautious stance, with sideways consolidation and a potential downside break below $178.85 remaining key focal points for traders in the near term.


-
 Afghanistan
-
 Albania
-
 Algeria
-
 Angola
-
 Argentina
-
 Armenia
-
 Australia
-
 Austria
-
 Azerbaijan
-
 Bahamas
-
 Bahrain
-
 Bangladesh
-
 Belarus
-
 Belgium
-
 Bolivia
-
 Botswana
-
 Brazil
-
 Brunei
-
 Bulgaria
-
 Cambodia
-
 Cameroon
-
 Canada
-
 Chile
Chile
-
 China
China
-
 Colombia
-
 Congo
Congo
-
 Costa Rica
-
 Cote d'Ivoire
-
 Croatia
-
 Cuba
Cuba
-
 Cyprus
-
 Czechia
-
 DR Congo
-
 Denmark
-
 Dominican Republic
-
 Ecuador
-
 Egypt
Egypt
-
 El Salvador
-
 Estonia
-
 Eswatini
-
 Ethiopia
-
 Finland
-
 France
-
 Georgia
-
 Germany
-
 Ghana
Ghana
-
 Greece
-
 Haiti
Haiti
-
 Hong Kong
-
 Hungary
-
 India
India
-
 Indonesia
-
 Iran, Islamic republic
-
 Iraq
Iraq
-
 Ireland
-
 Israel
-
 Italy
Italy
-
 Jamaica
-
 Japan
Japan
-
 Jordan
-
 Kazakhstan
-
 Kenya
Kenya
-
 Korea
Korea
-
 Kuwait
-
 Kyrgyzstan
-
 Laos
Laos
-
 Latvia
-
 Lebanon
-
 Lesotho
-
 Libya
Libya
-
 Lithuania
-
 Luxembourg
-
 Madagascar
-
 Malaysia
-
 Malta
Malta
-
 Mauritius
-
 Mexico
-
 Moldova
-
 Mongolia
-
 Montenegro
-
 Morocco
-
 Mozambique
-
 Myanmar
-
 Namibia
-
 Nepal
Nepal
-
 Netherlands
-
 New Zealand
-
 Nigeria
-
 North Macedonia
-
 Norway
-
 Oman
Oman
-
 Pakistan
-
 Palestine
-
 Panama
-
 Papua New Guinea
-
 Paraguay
-
 Peru
Peru
-
 Philippines
-
 Poland
-
 Portugal
-
 Puerto Rico
-
 Qatar
Qatar
-
 Reunion
-
 Romania
-
 Rwanda
-
 Saudi Arabia
-
 Serbia
-
 Singapore
-
 Slovakia
-
 Slovenia
-
 Somalia
-
 South Africa
-
 Spain
Spain
-
 Sri Lanka
-
 Sweden
-
 Switzerland
-
 Syria
Syria
-
 Taiwan
-
 Tajikistan
-
 Tanzania
-
 Thailand
-
 Trinidad and Tobago
-
 Tunisia
-
 Turkey
-
 UAE
UAE
-
 Uganda
-
 Ukraine
-
 United Kingdom
-
United States
-
 Uruguay
-
 Uzbekistan
-
 Venezuela
-
 Vietnam
-
 Yemen
Yemen
-
 Zambia
-
 Zimbabwe
- Forex
- Crypto
