
-6.83% for NuCana stock as tight trading range restricts moves

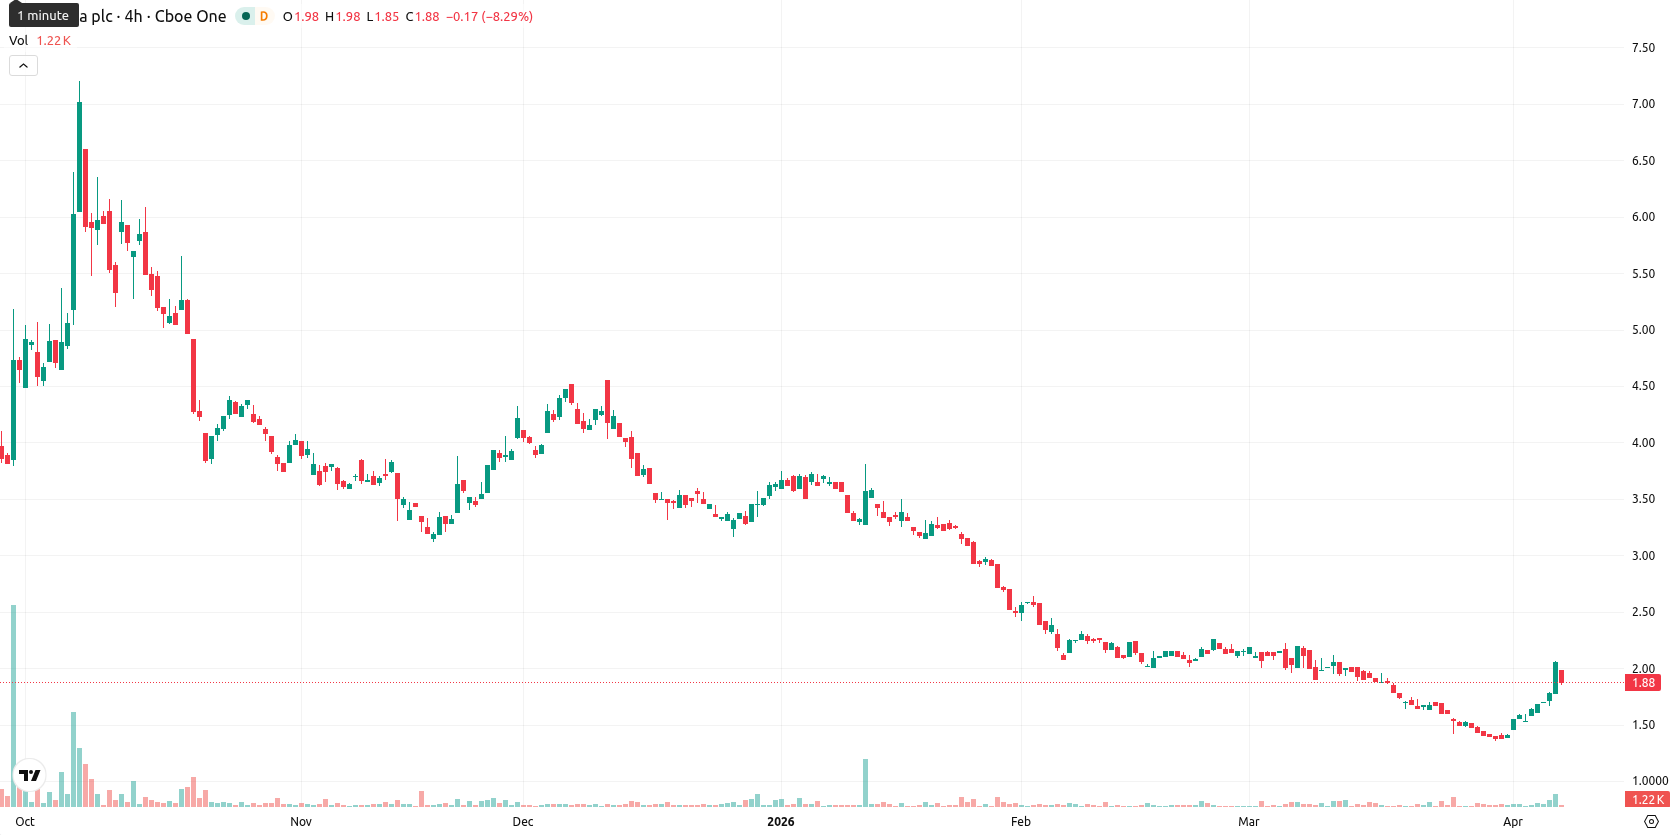
NuCana plc ADR (NCNA) is trading at $1.91, which is above its 20-day simple moving average (SMA) of $1.70 but remains below the 50-day SMA at $2.05 and significantly under the 200-day SMA at $4.74. This positioning reflects short-term strength for NCNA, while medium- and long-term technical pressure continues to weigh on the stock.
Highlights
- NCNA displays short-term strength but remains below key medium- and long-term technical resistance, signaling sustained downward pressure.
- Daily momentum indicators are mixed, showing an overbought condition conflicting with ongoing negative MACD and strong selling bias.
- NCNA is expected to trade between $1.85 and $2.10 next week, with downside scenarios more probable due to persistent weak technical signals.
Diverging momentum signals as buyers face strong trend resistance
On the technical front, NCNA faces immediate resistance at the D1 Ichimoku Kijun level of $1.78, and trades near the bottom of its daily range of $1.85 to $1.98 after opening lower. Momentum signals are mixed: the ADX reads 37.7, indicating a strong trend, while the MACD remains in "Strong Sell" territory. RSI stands at 59.9 (neutral-buy), Stoch RSI is flagged as overbought (100), and CCI shows modest buyer momentum at 85.6. BBP is at 0.46 with a "Strong Buy" signal, suggesting buyers are currently dominant, though the Awesome Oscillator is neutral and does not confirm the trend. There is notable divergence between overbought oscillators and ongoing negative MACD momentum, cautioning against relying on a single indicator.
Downside risk favored as volatility and sell signals dominate
Looking ahead, NCNA is expected to remain within a typical volatility band of $1.85 to $2.10 over the coming week, representing moves of roughly ±10% from current levels amid recent volatility. The probability of an upward move is very low (below 20%), with downside scenarios favored due to persistent sell signals across the weekly RSI, MACD, and longer-term SMAs. The baseline scenario calls for sideways trading between $1.85 and $2.10. A bullish case would require a breakout above resistance levels at $1.78 and the $2.05 SMA, while a break below $1.85 would open the door to further downside risk.
Previously it was reported that NuCana was experiencing persistent bearish pressure with limited prospects for a near-term rebound. Despite recent short-term strength, ongoing mixed momentum and trend signals mean traders should remain alert for a decisive move outside the $1.85 to $2.10 range, which would clarify the trend's next direction.


Latest NuCana News


-
 Afghanistan
-
 Albania
-
 Algeria
-
 Angola
-
 Argentina
-
 Armenia
-
 Australia
-
 Austria
-
 Azerbaijan
-
 Bahamas
-
 Bahrain
-
 Bangladesh
-
 Belarus
-
 Belgium
-
 Bolivia
-
 Botswana
-
 Brazil
-
 Brunei
-
 Bulgaria
-
 Cambodia
-
 Cameroon
-
 Canada
-
 Chile
Chile
-
 China
China
-
 Colombia
-
 Congo
Congo
-
 Costa Rica
-
 Cote d'Ivoire
-
 Croatia
-
 Cuba
Cuba
-
 Cyprus
-
 Czechia
-
 DR Congo
-
 Denmark
-
 Dominican Republic
-
 Ecuador
-
 Egypt
Egypt
-
 El Salvador
-
 Estonia
-
 Eswatini
-
 Ethiopia
-
 Finland
-
 France
-
 Georgia
-
 Germany
-
 Ghana
Ghana
-
 Greece
-
 Haiti
Haiti
-
 Hong Kong
-
 Hungary
-
 India
India
-
 Indonesia
-
 Iran, Islamic republic
-
 Iraq
Iraq
-
 Ireland
-
 Israel
-
 Italy
Italy
-
 Jamaica
-
 Japan
Japan
-
 Jordan
-
 Kazakhstan
-
 Kenya
Kenya
-
 Korea
Korea
-
 Kuwait
-
 Kyrgyzstan
-
 Laos
Laos
-
 Latvia
-
 Lebanon
-
 Lesotho
-
 Libya
Libya
-
 Lithuania
-
 Luxembourg
-
 Madagascar
-
 Malaysia
-
 Malta
Malta
-
 Mauritius
-
 Mexico
-
 Moldova
-
 Mongolia
-
 Montenegro
-
 Morocco
-
 Mozambique
-
 Myanmar
-
 Namibia
-
 Nepal
Nepal
-
 Netherlands
-
 New Zealand
-
 Nigeria
-
 North Macedonia
-
 Norway
-
 Oman
Oman
-
 Pakistan
-
 Palestine
-
 Panama
-
 Papua New Guinea
-
 Paraguay
-
 Peru
Peru
-
 Philippines
-
 Poland
-
 Portugal
-
 Puerto Rico
-
 Qatar
Qatar
-
 Reunion
-
 Romania
-
 Rwanda
-
 Saudi Arabia
-
 Serbia
-
 Singapore
-
 Slovakia
-
 Slovenia
-
 Somalia
-
 South Africa
-
 Spain
Spain
-
 Sri Lanka
-
 Sweden
-
 Switzerland
-
 Syria
Syria
-
 Taiwan
-
 Tajikistan
-
 Tanzania
-
 Thailand
-
 Trinidad and Tobago
-
 Tunisia
-
 Turkey
-
 UAE
UAE
-
 Uganda
-
 Ukraine
-
 United Kingdom
-
United States
-
 Uruguay
-
 Uzbekistan
-
 Venezuela
-
 Vietnam
-
 Yemen
Yemen
-
 Zambia
-
 Zimbabwe
- Forex
- Crypto
