
-2.19% for Sundial Growers stock as technical momentum favors sellers

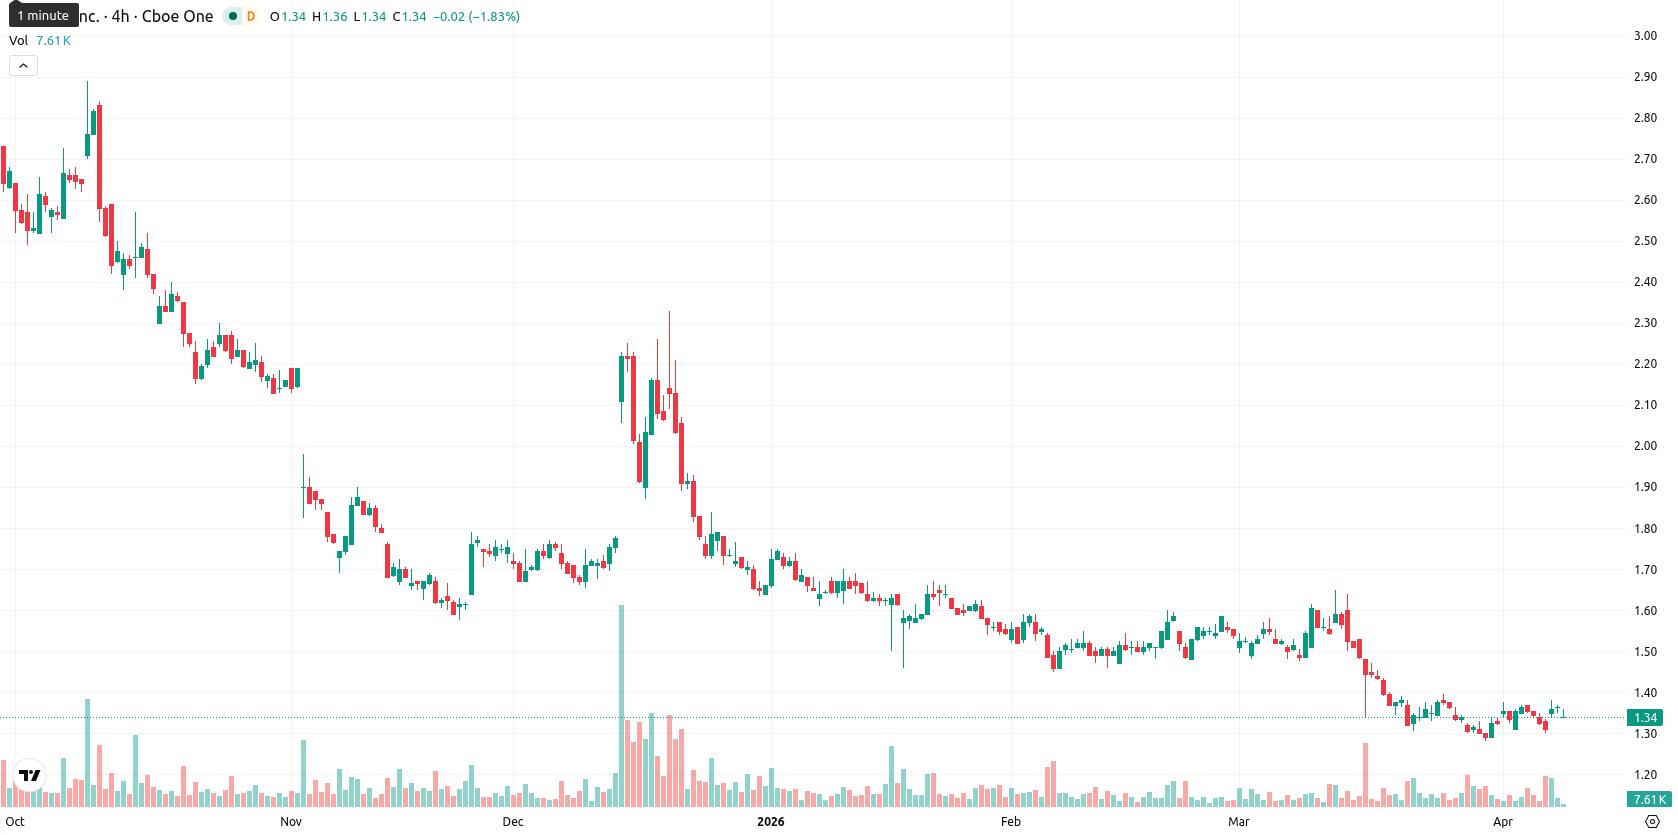
Sundial Growers Inc. (SNDL) is trading at $1.34 after a daily decline of 2.19%, positioning below the MA-20 ($1.38), MA-50 ($1.47), and MA-200 ($1.82), which maintains a bearish stance versus key moving averages.
Highlights
- SNDL trades below key moving averages with bearish momentum dominating across short-, medium-, and long-term timeframes.
- Traders face strong resistance near $1.42 and immediate support at $1.33, with the stock hovering close to its lower trading range.
- Technical indicators suggest a sideways movement between $1.33 and $1.42 over the next five days, with downside risk prevailing.
Bearish signals mixed with momentum divergences amid muted volatility
Bearish momentum dominates, with MACD on D1 and W1 both signaling strong downside and ADX on D1 indicating a sell, though the trend strength is moderate at best. RSI sits in sell territory at 45.36 on D1 and 38.77 on W1, while Stoch RSI is extremely overbought on D1 but turns oversold on intraday charts, and CCI is neutral. BBP signals strong buyer presence on D1, a sign of potential near-term support, but AO remains neutral and does not reinforce the prevailing downtrend. The daily decline of 2.19% came with no significant gap (yesterday’s close $1.37, today’s open $1.35), and the stock now trades at the bottom of today’s narrow range ($1.34–$1.35), reflecting low intraday volatility and renewed selling pressure after the open. The momentum indicators and oscillators show notable divergences, with short-term oscillators mixed against predominantly bearish directional signals, which clouds the intraday outlook.
Further downside favored as range support faces renewed risk
Over the next five trading days, SNDL is expected to fluctuate between $1.33 and $1.42, with the current price near the bottom of this range. The probability of a sustained move higher is very low (less than 20%), making further downside more likely. The baseline scenario sees SNDL remaining trapped in a sideways corridor between $1.33 and $1.42. In a bullish scenario, a decisive break above $1.42 would open the way for a squeeze toward higher resistance. Alternatively, if $1.33 fails as support, a bearish wave could take the stock toward new local lows.
Earlier, analysts noted that Sundial Growers faced persistent bearish momentum with elevated downside risk and limited prospects for a meaningful reversal. The latest technical signals largely reinforce this negative bias, with fresh divergences among key oscillators underscoring the importance of monitoring $1.33 as a pivotal support level for potential downside acceleration.


-
 Afghanistan
-
 Albania
-
 Algeria
-
 Angola
-
 Argentina
-
 Armenia
-
 Australia
-
 Austria
-
 Azerbaijan
-
 Bahamas
-
 Bahrain
-
 Bangladesh
-
 Belarus
-
 Belgium
-
 Bolivia
-
 Botswana
-
 Brazil
-
 Brunei
-
 Bulgaria
-
 Cambodia
-
 Cameroon
-
 Canada
-
 Chile
Chile
-
 China
China
-
 Colombia
-
 Congo
Congo
-
 Costa Rica
-
 Cote d'Ivoire
-
 Croatia
-
 Cuba
Cuba
-
 Cyprus
-
 Czechia
-
 DR Congo
-
 Denmark
-
 Dominican Republic
-
 Ecuador
-
 Egypt
Egypt
-
 El Salvador
-
 Estonia
-
 Eswatini
-
 Ethiopia
-
 Finland
-
 France
-
 Georgia
-
 Germany
-
 Ghana
Ghana
-
 Greece
-
 Haiti
Haiti
-
 Hong Kong
-
 Hungary
-
 India
India
-
 Indonesia
-
 Iran, Islamic republic
-
 Iraq
Iraq
-
 Ireland
-
 Israel
-
 Italy
Italy
-
 Jamaica
-
 Japan
Japan
-
 Jordan
-
 Kazakhstan
-
 Kenya
Kenya
-
 Korea
Korea
-
 Kuwait
-
 Kyrgyzstan
-
 Laos
Laos
-
 Latvia
-
 Lebanon
-
 Lesotho
-
 Libya
Libya
-
 Lithuania
-
 Luxembourg
-
 Madagascar
-
 Malaysia
-
 Malta
Malta
-
 Mauritius
-
 Mexico
-
 Moldova
-
 Mongolia
-
 Montenegro
-
 Morocco
-
 Mozambique
-
 Myanmar
-
 Namibia
-
 Nepal
Nepal
-
 Netherlands
-
 New Zealand
-
 Nigeria
-
 North Macedonia
-
 Norway
-
 Oman
Oman
-
 Pakistan
-
 Palestine
-
 Panama
-
 Papua New Guinea
-
 Paraguay
-
 Peru
Peru
-
 Philippines
-
 Poland
-
 Portugal
-
 Puerto Rico
-
 Qatar
Qatar
-
 Reunion
-
 Romania
-
 Rwanda
-
 Saudi Arabia
-
 Serbia
-
 Singapore
-
 Slovakia
-
 Slovenia
-
 Somalia
-
 South Africa
-
 Spain
Spain
-
 Sri Lanka
-
 Sweden
-
 Switzerland
-
 Syria
Syria
-
 Taiwan
-
 Tajikistan
-
 Tanzania
-
 Thailand
-
 Trinidad and Tobago
-
 Tunisia
-
 Turkey
-
 UAE
UAE
-
 Uganda
-
 Ukraine
-
 United Kingdom
-
United States
-
 Uruguay
-
 Uzbekistan
-
 Venezuela
-
 Vietnam
-
 Yemen
Yemen
-
 Zambia
-
 Zimbabwe
- Forex
- Crypto
