
Long-term undervaluation lifts Quantum Computing stock to a 4.87% daily increase

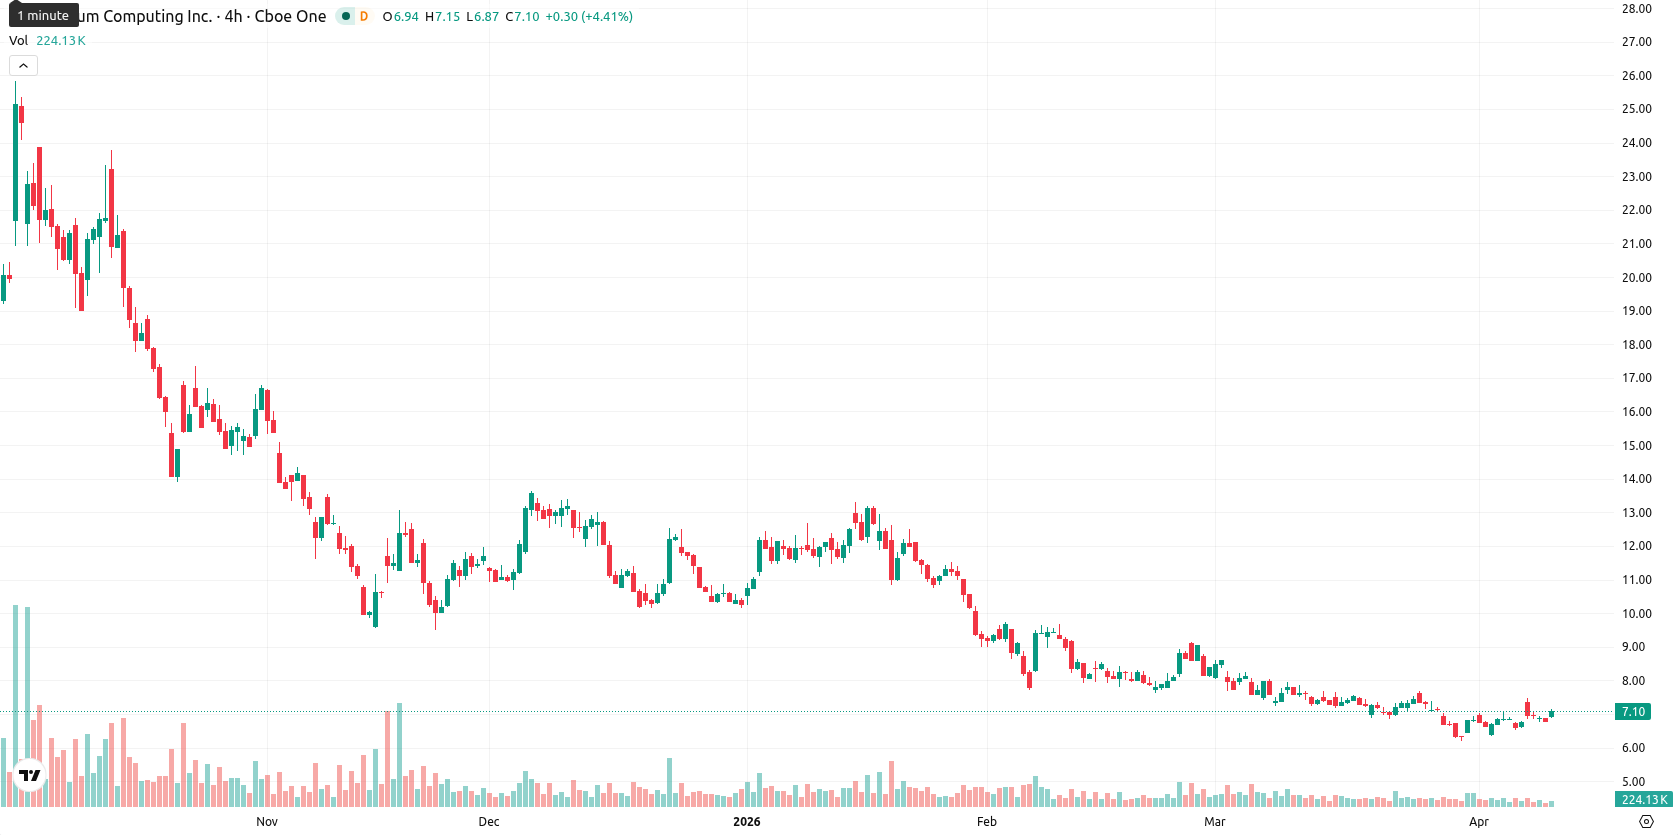
Quantum Computing Inc. (QUBT) is trading at $7.11, which is just above the SMA-20 ($7.05) but well below both the SMA-50 ($7.95) and SMA-200 ($13.47), indicating some short-term stabilization, while medium- and long-term trends remain bearish. The Ichimoku Kijun is at $7.22, currently acting as immediate resistance.
Highlights
- QUBT is stabilizing near $7.11, trading below key longer-term averages that confirm ongoing bearish trends.
- Technical indicators signal weak momentum, with bearish readings dominating and no clear trend strength established.
- For the next five trading days, QUBT is likely to range between $6.40 and $7.60, with downside risk prevailing.
Mixed oscillator signals as momentum remains weak and trend unclear
Momentum signals remain weak, with the D1 MACD showing strong bearishness and the ADX at 24.47 indicating a lack of clear trend strength. Both D1 RSI (41.20, Sell) and CCI (-57.87, Sell) point toward mild downside momentum, while Stoch RSI is in overbought territory, suggesting a potential for near-term cooling. BBP is slightly positive (0.02, Buy), signaling marginal buyer dominance intraday. The stock opened slightly higher than the previous close, showing a gap up from $6.78 to $6.94. With the current price positioned near today’s high ($7.14), intraday volatility is moderate, and early gains reflect strength toward session highs. However, the mix of oversold and overbought oscillator readings underscores a divergence between short-term optimism and broader downside tendencies.
Downside potential prevails as volatility and resistance cap upside
For the next five trading days, QUBT’s price is expected to fluctuate between $6.40 and $7.60, fitting the observed volatility profile and keeping within 10% of the current price. The probability of a price increase is very low (less than 20%), with downside movement appearing much more likely based on weekly RSI, ADX, MACD, and MA-50 signals. In the baseline scenario, price consolidates in a sideways range between $6.40 and $7.60. A bullish scenario would see a break above immediate resistance at $7.22, opening potential toward the upper end of the range. The bearish scenario involves the price slipping below the $6.40 area, exposing renewed selling pressure.
Previously it was reported that Quantum Computing Inc. continued to face broad-based selling pressure and a persistently bearish technical outlook. The current analysis reinforces this view, highlighting that downside risk remains elevated in the near term, with traders advised to monitor the $7.22 resistance and $6.40 support as key inflection points for potential breakouts.


Latest Quantum Computing News


-
 Afghanistan
-
 Albania
-
 Algeria
-
 Angola
-
 Argentina
-
 Armenia
-
 Australia
-
 Austria
-
 Azerbaijan
-
 Bahamas
-
 Bahrain
-
 Bangladesh
-
 Belarus
-
 Belgium
-
 Bolivia
-
 Botswana
-
 Brazil
-
 Brunei
-
 Bulgaria
-
 Cambodia
-
 Cameroon
-
 Canada
-
 Chile
Chile
-
 China
China
-
 Colombia
-
 Congo
Congo
-
 Costa Rica
-
 Cote d'Ivoire
-
 Croatia
-
 Cuba
Cuba
-
 Cyprus
-
 Czechia
-
 DR Congo
-
 Denmark
-
 Dominican Republic
-
 Ecuador
-
 Egypt
Egypt
-
 El Salvador
-
 Estonia
-
 Eswatini
-
 Ethiopia
-
 Finland
-
 France
-
 Georgia
-
 Germany
-
 Ghana
Ghana
-
 Greece
-
 Haiti
Haiti
-
 Hong Kong
-
 Hungary
-
 India
India
-
 Indonesia
-
 Iran, Islamic republic
-
 Iraq
Iraq
-
 Ireland
-
 Israel
-
 Italy
Italy
-
 Jamaica
-
 Japan
Japan
-
 Jordan
-
 Kazakhstan
-
 Kenya
Kenya
-
 Korea
Korea
-
 Kuwait
-
 Kyrgyzstan
-
 Laos
Laos
-
 Latvia
-
 Lebanon
-
 Lesotho
-
 Libya
Libya
-
 Lithuania
-
 Luxembourg
-
 Madagascar
-
 Malaysia
-
 Malta
Malta
-
 Mauritius
-
 Mexico
-
 Moldova
-
 Mongolia
-
 Montenegro
-
 Morocco
-
 Mozambique
-
 Myanmar
-
 Namibia
-
 Nepal
Nepal
-
 Netherlands
-
 New Zealand
-
 Nigeria
-
 North Macedonia
-
 Norway
-
 Oman
Oman
-
 Pakistan
-
 Palestine
-
 Panama
-
 Papua New Guinea
-
 Paraguay
-
 Peru
Peru
-
 Philippines
-
 Poland
-
 Portugal
-
 Puerto Rico
-
 Qatar
Qatar
-
 Reunion
-
 Romania
-
 Rwanda
-
 Saudi Arabia
-
 Serbia
-
 Singapore
-
 Slovakia
-
 Slovenia
-
 Somalia
-
 South Africa
-
 Spain
Spain
-
 Sri Lanka
-
 Sweden
-
 Switzerland
-
 Syria
Syria
-
 Taiwan
-
 Tajikistan
-
 Tanzania
-
 Thailand
-
 Trinidad and Tobago
-
 Tunisia
-
 Turkey
-
 UAE
UAE
-
 Uganda
-
 Ukraine
-
 United Kingdom
-
United States
-
 Uruguay
-
 Uzbekistan
-
 Venezuela
-
 Vietnam
-
 Yemen
Yemen
-
 Zambia
-
 Zimbabwe
- Forex
- Crypto
