
-4.79% for Intuit stock as Mailchimp growth outlook dims

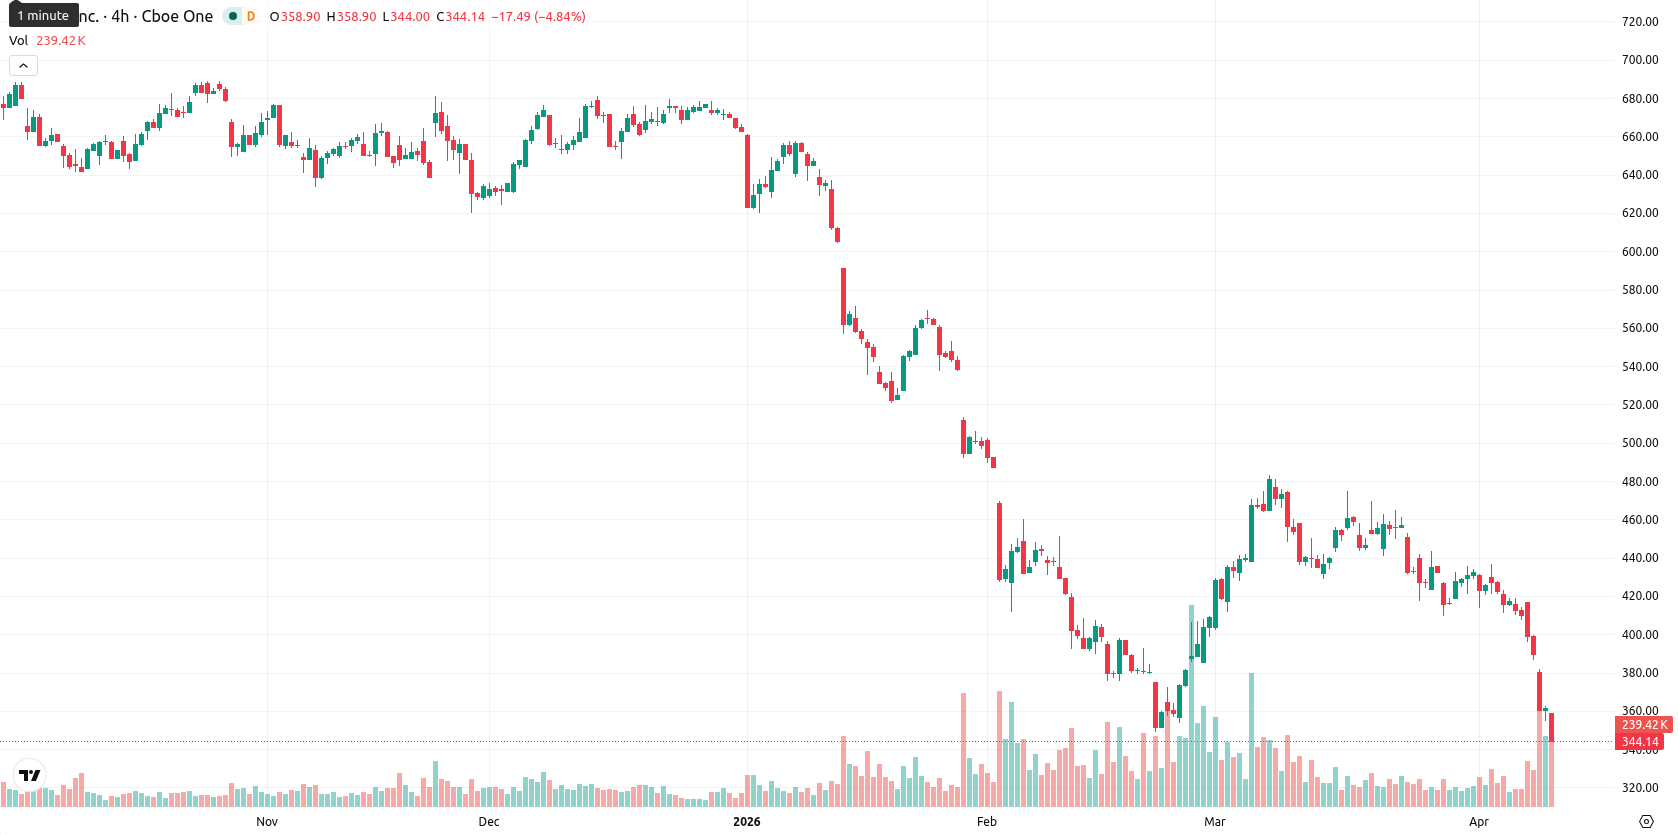
Intuit Inc. (INTU) is trading at $344.29, down 4.79% today and sitting well below its 20-day, 50-day, and 200-day simple moving averages. The asset remains under significant selling pressure across all major trends.
Highlights
- Intuit surpassed Q2 fiscal 2026 guidance, driven by robust mid-market growth and a rebound in Credit Karma, though Mailchimp was stagnant.
- The company finished the FedNow Service readiness program, raised its dividend to $1.20 per share, and commenced an accelerated share buyback while halting management’s prescheduled stock sales.
- INTU trades well below key averages with oversold indicators, facing persistent selling pressure and expected to consolidate between $340.00 and $355.00 short term.
Quarterly earnings beat and strategic moves amid persistent market selloff
On April 9, 2026, Intuit completed the Federal Reserve's readiness program for the FedNow Service, enabling the launch of instant payment solutions to its business clients. The company reported second quarter fiscal 2026 financial results that exceeded management’s guidance, highlighted by double-digit mid-market segment growth and a recovery in Credit Karma, while Mailchimp showed stagnation. Intuit also increased its dividend to $1.20 per share and confirmed the implementation of an accelerated share buyback program, as well as a pause on pre-scheduled stock sale plans by management. These developments occurred alongside broader selling pressure.
Bearish momentum intensifies as price action nears oversold extremes
INTU is currently trading at $344.29, which is well below the SMA-20 at $429.92, SMA-50 at $429.64, and SMA-200 at $619.01. This indicates strong selling pressure across the short, medium, and long-term trends. The Ichimoku Kijun level is at $419.02, far above the current price and marking immediate resistance. Momentum signals remain decisively bearish, with both MACD and ADX on D1 and W1 showing persistent downward momentum. RSI stands at 27.57 on D1 and 30.85 on W1, both signaling oversold conditions, and CCI and Stoch RSI also confirm an oversold environment. BBP is deeply negative, affirming that sellers dominate intraday action. The AO is aligned with the downward trend. After opening at $353.84 below the previous close of $361.60 (a clear gap down), the price fell further toward the day's low and now sits near the lower end of today’s range, reflecting high intraday volatility and ongoing post-open selling pressure. Intraday performance and momentum indicators reinforce each other, signaling continued bearish sentiment with no major divergence observed.
Sustained downside risk dominates short-term range-bound outlook
For the next five trading days, INTU is expected to trade between $340.00 and $355.00, reflecting a volatility band relative to current levels. The probability of a price increase is very low (less than 20%), suggesting a further decline is more likely in the short term. The baseline scenario is further sideways consolidation with high volatility in the $340.00 to $355.00 range. A bullish move would require a sustained break above $355.00, targeting $360.00–$365.00, while a drop below $340.00 on heavy selling could accelerate downside pressure.
Earlier, analysts noted that Intuit remained under sustained downside pressure, with technical indicators signaling a prevailing bearish bias across all timeframes. The latest price action and deeply oversold momentum readings strengthen this negative outlook, with traders now watching the $340.00 support as a pivotal level that could trigger further volatility or downside acceleration if breached.


-
 Afghanistan
-
 Albania
-
 Algeria
-
 Angola
-
 Argentina
-
 Armenia
-
 Australia
-
 Austria
-
 Azerbaijan
-
 Bahamas
-
 Bahrain
-
 Bangladesh
-
 Belarus
-
 Belgium
-
 Bolivia
-
 Botswana
-
 Brazil
-
 Brunei
-
 Bulgaria
-
 Cambodia
-
 Cameroon
-
 Canada
-
 Chile
Chile
-
 China
China
-
 Colombia
-
 Congo
Congo
-
 Costa Rica
-
 Cote d'Ivoire
-
 Croatia
-
 Cuba
Cuba
-
 Cyprus
-
 Czechia
-
 DR Congo
-
 Denmark
-
 Dominican Republic
-
 Ecuador
-
 Egypt
Egypt
-
 El Salvador
-
 Estonia
-
 Eswatini
-
 Ethiopia
-
 Finland
-
 France
-
 Georgia
-
 Germany
-
 Ghana
Ghana
-
 Greece
-
 Haiti
Haiti
-
 Hong Kong
-
 Hungary
-
 India
India
-
 Indonesia
-
 Iran, Islamic republic
-
 Iraq
Iraq
-
 Ireland
-
 Israel
-
 Italy
Italy
-
 Jamaica
-
 Japan
Japan
-
 Jordan
-
 Kazakhstan
-
 Kenya
Kenya
-
 Korea
Korea
-
 Kuwait
-
 Kyrgyzstan
-
 Laos
Laos
-
 Latvia
-
 Lebanon
-
 Lesotho
-
 Libya
Libya
-
 Lithuania
-
 Luxembourg
-
 Madagascar
-
 Malaysia
-
 Malta
Malta
-
 Mauritius
-
 Mexico
-
 Moldova
-
 Mongolia
-
 Montenegro
-
 Morocco
-
 Mozambique
-
 Myanmar
-
 Namibia
-
 Nepal
Nepal
-
 Netherlands
-
 New Zealand
-
 Nigeria
-
 North Macedonia
-
 Norway
-
 Oman
Oman
-
 Pakistan
-
 Palestine
-
 Panama
-
 Papua New Guinea
-
 Paraguay
-
 Peru
Peru
-
 Philippines
-
 Poland
-
 Portugal
-
 Puerto Rico
-
 Qatar
Qatar
-
 Reunion
-
 Romania
-
 Rwanda
-
 Saudi Arabia
-
 Serbia
-
 Singapore
-
 Slovakia
-
 Slovenia
-
 Somalia
-
 South Africa
-
 Spain
Spain
-
 Sri Lanka
-
 Sweden
-
 Switzerland
-
 Syria
Syria
-
 Taiwan
-
 Tajikistan
-
 Tanzania
-
 Thailand
-
 Trinidad and Tobago
-
 Tunisia
-
 Turkey
-
 UAE
UAE
-
 Uganda
-
 Ukraine
-
 United Kingdom
-
United States
-
 Uruguay
-
 Uzbekistan
-
 Venezuela
-
 Vietnam
-
 Yemen
Yemen
-
 Zambia
-
 Zimbabwe
- Forex
- Crypto
