
Institutional investors increase holdings driving Nvidia stock up 1.12%

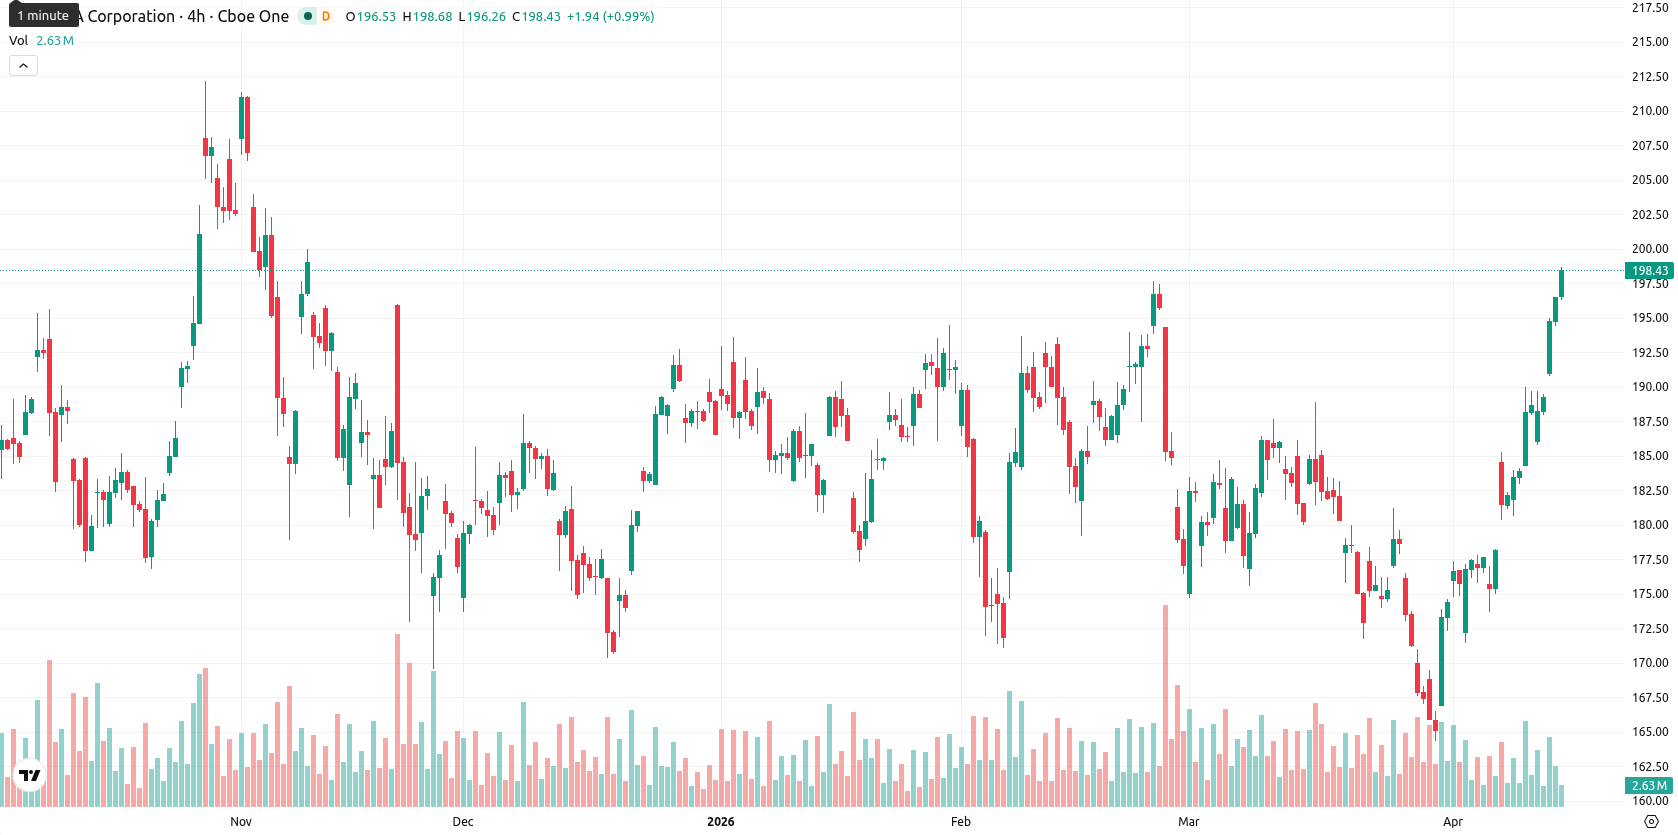
Nvidia Corporation (NVDA) is trading at $198.60, up 1.12% for the day and holding above its SMA-20 ($178.55), SMA-50 ($182.12), and SMA-200 ($181.12) levels, confirming clear bullish momentum across all major timeframes. The Ichimoku Kijun level at $180.37 serves as immediate support beneath the current price.
Highlights
- Nvidia introduced Ising, an open-source quantum AI model family, aiming to advance quantum computing development.
- Institutional investors increased exposure, while Nvidia's market cap surged to approximately $4.73 trillion ahead of its Rubin (R100) roadmap update.
- Price trades near record highs and overbought indicators signal buyer dominance, with strong support at $192.66 and likely consolidation below $200.
Institutional accumulation and AI roadmap drive investor optimism
Nvidia has announced the launch of Ising, an open-source family of quantum AI models aimed at accelerating practical quantum computing development. The company also provided a roadmap outlining the transition from its Blackwell Ultra (B300) architecture to the future Rubin (R100) series, with release planned for the second half of 2026. Major institutional investors, including Bouchey Financial Group Ltd, have increased their holdings, while Nvidia's market capitalization has reached approximately $4.73 trillion.
Overbought signals and neutral momentum raise divergence caution
Momentum signals for NVDA are somewhat mixed, with the MACD remaining neutral and the ADX indicating a weak trend, but the RSI at 67.96 suggests bullish energy. Oscillators such as the Stoch RSI (100.00) and CCI (206.75) highlight overbought conditions, with Bull/Bear Power (BBP) showing strong buyer dominance intraday. The Awesome Oscillator supports the ongoing upward move, and price action is clustered near the top of the daily range ($196.30 – $198.68), suggesting moderate volatility and persistent strength. This sharp intraday gain combined with overbought oscillators and neutral trend indicators signals a potential divergence, warranting caution.
Limited downside risk as high consolidation probability guides outlook
Looking into the next five trading days, the anticipated price range is $192.66 to $198.68, forming a typical volatility band relative to current levels. There is a very high probability (over 80%) of consolidation or sustained gains, while the likelihood of a significant downside move appears limited. The baseline scenario projects a sideways range just below $200. Bullish continuation may develop if resistance at $198.68 is breached, while a breakdown below $192.66 could trigger a deeper retracement, though this scenario remains unlikely according to current technical signals.
Previously it was reported that Nvidia's unveiling of its Ising quantum AI models spurred renewed investor interest in the intersection of artificial intelligence and quantum computing, driving up related technology stocks. Building on this momentum, Nvidia's ongoing bullish structure and recent institutional accumulation suggest traders should monitor the $198.68 resistance for potential upside breakouts, while remaining alert to any divergence signals that could precede short-term consolidation.


-
 Afghanistan
-
 Albania
-
 Algeria
-
 Angola
-
 Argentina
-
 Armenia
-
 Australia
-
 Austria
-
 Azerbaijan
-
 Bahamas
-
 Bahrain
-
 Bangladesh
-
 Belarus
-
 Belgium
-
 Bolivia
-
 Botswana
-
 Brazil
-
 Brunei
-
 Bulgaria
-
 Cambodia
-
 Cameroon
-
 Canada
-
 Chile
Chile
-
 China
China
-
 Colombia
-
 Congo
Congo
-
 Costa Rica
-
 Cote d'Ivoire
-
 Croatia
-
 Cuba
Cuba
-
 Cyprus
-
 Czechia
-
 DR Congo
-
 Denmark
-
 Dominican Republic
-
 Ecuador
-
 Egypt
Egypt
-
 El Salvador
-
 Estonia
-
 Eswatini
-
 Ethiopia
-
 Finland
-
 France
-
 Georgia
-
 Germany
-
 Ghana
Ghana
-
 Greece
-
 Haiti
Haiti
-
 Hong Kong
-
 Hungary
-
 India
India
-
 Indonesia
-
 Iran, Islamic republic
-
 Iraq
Iraq
-
 Ireland
-
 Israel
-
 Italy
Italy
-
 Jamaica
-
 Japan
Japan
-
 Jordan
-
 Kazakhstan
-
 Kenya
Kenya
-
 Korea
Korea
-
 Kuwait
-
 Kyrgyzstan
-
 Laos
Laos
-
 Latvia
-
 Lebanon
-
 Lesotho
-
 Libya
Libya
-
 Lithuania
-
 Luxembourg
-
 Madagascar
-
 Malaysia
-
 Malta
Malta
-
 Mauritius
-
 Mexico
-
 Moldova
-
 Mongolia
-
 Montenegro
-
 Morocco
-
 Mozambique
-
 Myanmar
-
 Namibia
-
 Nepal
Nepal
-
 Netherlands
-
 New Zealand
-
 Nigeria
-
 North Macedonia
-
 Norway
-
 Oman
Oman
-
 Pakistan
-
 Palestine
-
 Panama
-
 Papua New Guinea
-
 Paraguay
-
 Peru
Peru
-
 Philippines
-
 Poland
-
 Portugal
-
 Puerto Rico
-
 Qatar
Qatar
-
 Reunion
-
 Romania
-
 Rwanda
-
 Saudi Arabia
-
 Serbia
-
 Singapore
-
 Slovakia
-
 Slovenia
-
 Somalia
-
 South Africa
-
 Spain
Spain
-
 Sri Lanka
-
 Sweden
-
 Switzerland
-
 Syria
Syria
-
 Taiwan
-
 Tajikistan
-
 Tanzania
-
 Thailand
-
 Trinidad and Tobago
-
 Tunisia
-
 Turkey
-
 UAE
UAE
-
 Uganda
-
 Ukraine
-
 United Kingdom
-
United States
-
 Uruguay
-
 Uzbekistan
-
 Venezuela
-
 Vietnam
-
 Yemen
Yemen
-
 Zambia
-
 Zimbabwe
- Forex
- Crypto
