
Microsoft stock price forecast: $434.00 resistance as MSFT edges higher

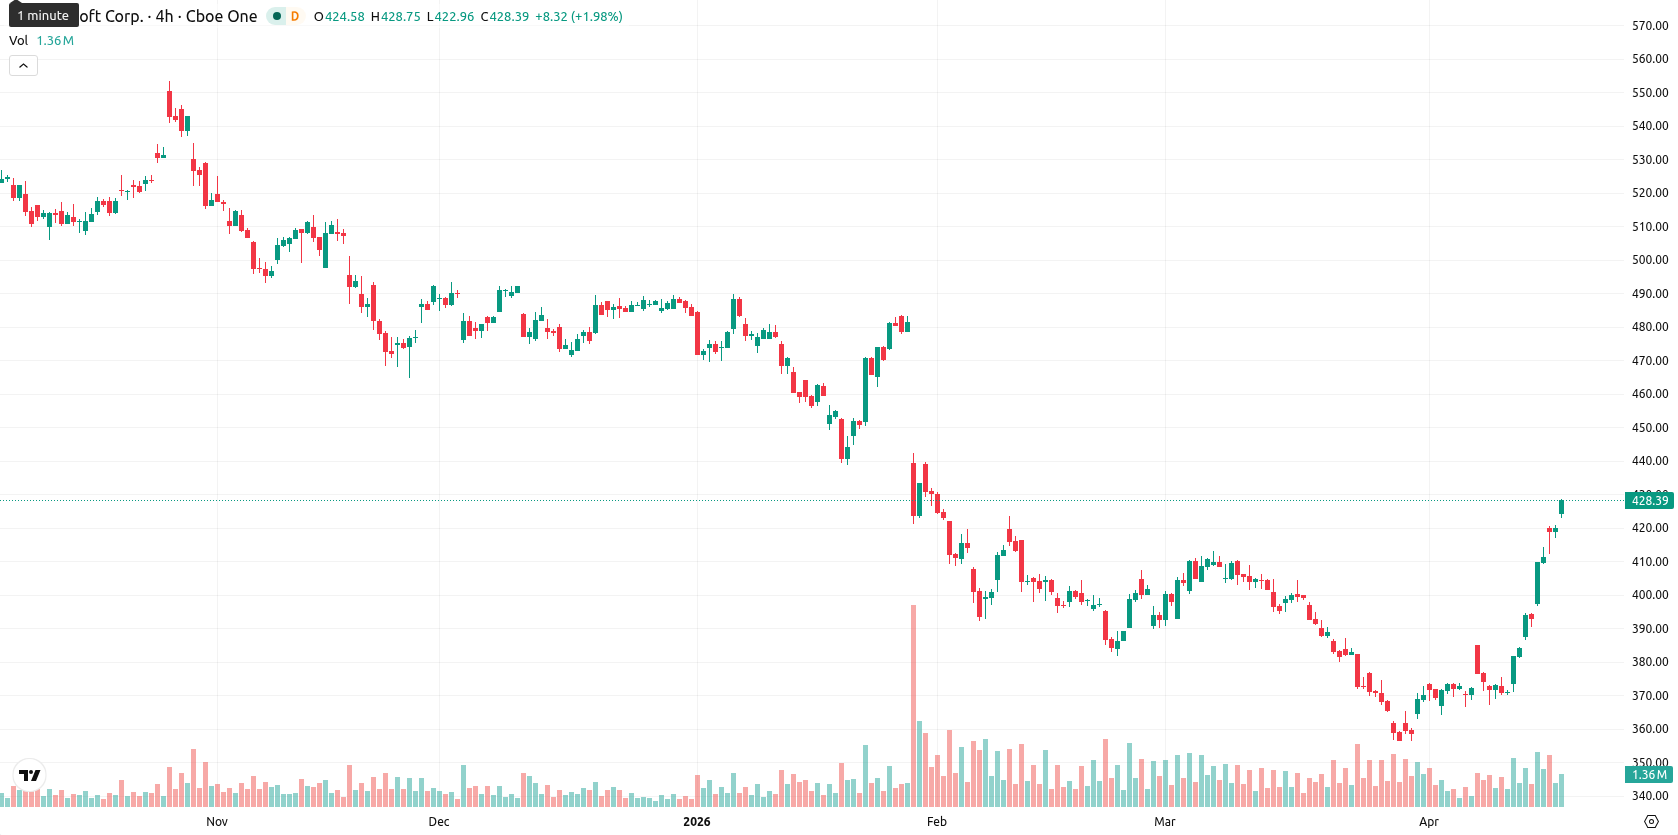
Microsoft Corporation (MSFT) is trading at $424.44 after a daily gain of 1.06%, positioning above both the SMA-20 ($378.21) and SMA-50 ($392.08) but still beneath the SMA-200 ($472.29). This structure confirms a bullish outlook in the short and medium term, while longer-term momentum remains subdued; the Ichimoku Kijun support is noted at $388.54.
Highlights
- Microsoft and Stellantis signed a five-year strategic agreement to jointly develop AI, cybersecurity, and engineering solutions.
- Growth momentum is accelerating from strong Azure demand and rapid adoption of Copilot AI ahead of the next earnings report.
- MSFT trades with short-term bullish momentum and overbought technical signals, expected to consolidate between $414.00 and $434.00 in the near term.
Operational momentum accelerates as AI partnerships and cloud growth drive sentiment
Microsoft recently entered a five-year strategic partnership with Stellantis to co-develop AI, cybersecurity, and engineering solutions. Additional growth is being driven by strong demand for Azure and accelerating adoption of the Copilot AI solution, reflecting an upswing in the company’s artificial intelligence activities and data center expansion. The news flow shows robust operational momentum ahead of the next earnings report.
Overbought signals caution as momentum indicators remain mixed
Momentum readings for MSFT are mixed, with a daily MACD in neutral territory and an ADX at 25.50 highlighting an ongoing upward move. Support is defined by the SMA-50 ($392.08) and the Ichimoku Kijun level ($388.54), while resistance is seen near $434.00. Intraday volatility remains low, the price is mid-range after opening higher with a gap, and oscillators including RSI (70.65), Stoch RSI (100.00), CCI (248.63), and BBP (32.79) signal that the asset is overbought. The Awesome Oscillator maintains a "Strong Buy" reading, but the broad set of overbought signals advise caution for additional immediate upside.
Risk of pullback rises as price tests consolidation range
Over the next five trading days, MSFT is expected to fluctuate within a typical volatility band between $414.00 and $434.00. A bullish breakout would require a firm move above the $434.00 resistance, while a drop below $414.00 could unfold if overbought pressures lead to selling. Sideways consolidation within this price corridor remains the baseline scenario, as prevailing long-term technical signals suggest a higher risk of pullback than a sustained advance.
Earlier, analysts noted that Microsoft’s strong profitability and investor demand were enabling the stock to recover from previous bouts of selling pressure related to AI infrastructure investments. In light of the current signals of overbought conditions and sustained technical momentum, traders should focus on how the stock reacts near the $434.00 resistance, as a failure to clear this level may lead to a deeper pullback or extended sideways consolidation in the near term.


Latest Microsoft News


-
 Afghanistan
-
 Albania
-
 Algeria
-
 Angola
-
 Argentina
-
 Armenia
-
 Australia
-
 Austria
-
 Azerbaijan
-
 Bahamas
-
 Bahrain
-
 Bangladesh
-
 Belarus
-
 Belgium
-
 Bolivia
-
 Botswana
-
 Brazil
-
 Brunei
-
 Bulgaria
-
 Cambodia
-
 Cameroon
-
 Canada
-
 Chile
Chile
-
 China
China
-
 Colombia
-
 Congo
Congo
-
 Costa Rica
-
 Cote d'Ivoire
-
 Croatia
-
 Cuba
Cuba
-
 Cyprus
-
 Czechia
-
 DR Congo
-
 Denmark
-
 Dominican Republic
-
 Ecuador
-
 Egypt
Egypt
-
 El Salvador
-
 Estonia
-
 Eswatini
-
 Ethiopia
-
 Finland
-
 France
-
 Georgia
-
 Germany
-
 Ghana
Ghana
-
 Greece
-
 Haiti
Haiti
-
 Hong Kong
-
 Hungary
-
 India
India
-
 Indonesia
-
 Iran, Islamic republic
-
 Iraq
Iraq
-
 Ireland
-
 Israel
-
 Italy
Italy
-
 Jamaica
-
 Japan
Japan
-
 Jordan
-
 Kazakhstan
-
 Kenya
Kenya
-
 Korea
Korea
-
 Kuwait
-
 Kyrgyzstan
-
 Laos
Laos
-
 Latvia
-
 Lebanon
-
 Lesotho
-
 Libya
Libya
-
 Lithuania
-
 Luxembourg
-
 Madagascar
-
 Malaysia
-
 Malta
Malta
-
 Mauritius
-
 Mexico
-
 Moldova
-
 Mongolia
-
 Montenegro
-
 Morocco
-
 Mozambique
-
 Myanmar
-
 Namibia
-
 Nepal
Nepal
-
 Netherlands
-
 New Zealand
-
 Nigeria
-
 North Macedonia
-
 Norway
-
 Oman
Oman
-
 Pakistan
-
 Palestine
-
 Panama
-
 Papua New Guinea
-
 Paraguay
-
 Peru
Peru
-
 Philippines
-
 Poland
-
 Portugal
-
 Puerto Rico
-
 Qatar
Qatar
-
 Reunion
-
 Romania
-
 Rwanda
-
 Saudi Arabia
-
 Serbia
-
 Singapore
-
 Slovakia
-
 Slovenia
-
 Somalia
-
 South Africa
-
 Spain
Spain
-
 Sri Lanka
-
 Sweden
-
 Switzerland
-
 Syria
Syria
-
 Taiwan
-
 Tajikistan
-
 Tanzania
-
 Thailand
-
 Trinidad and Tobago
-
 Tunisia
-
 Turkey
-
 UAE
UAE
-
 Uganda
-
 Ukraine
-
 United Kingdom
-
United States
-
 Uruguay
-
 Uzbekistan
-
 Venezuela
-
 Vietnam
-
 Yemen
Yemen
-
 Zambia
-
 Zimbabwe
- Forex
- Crypto
