
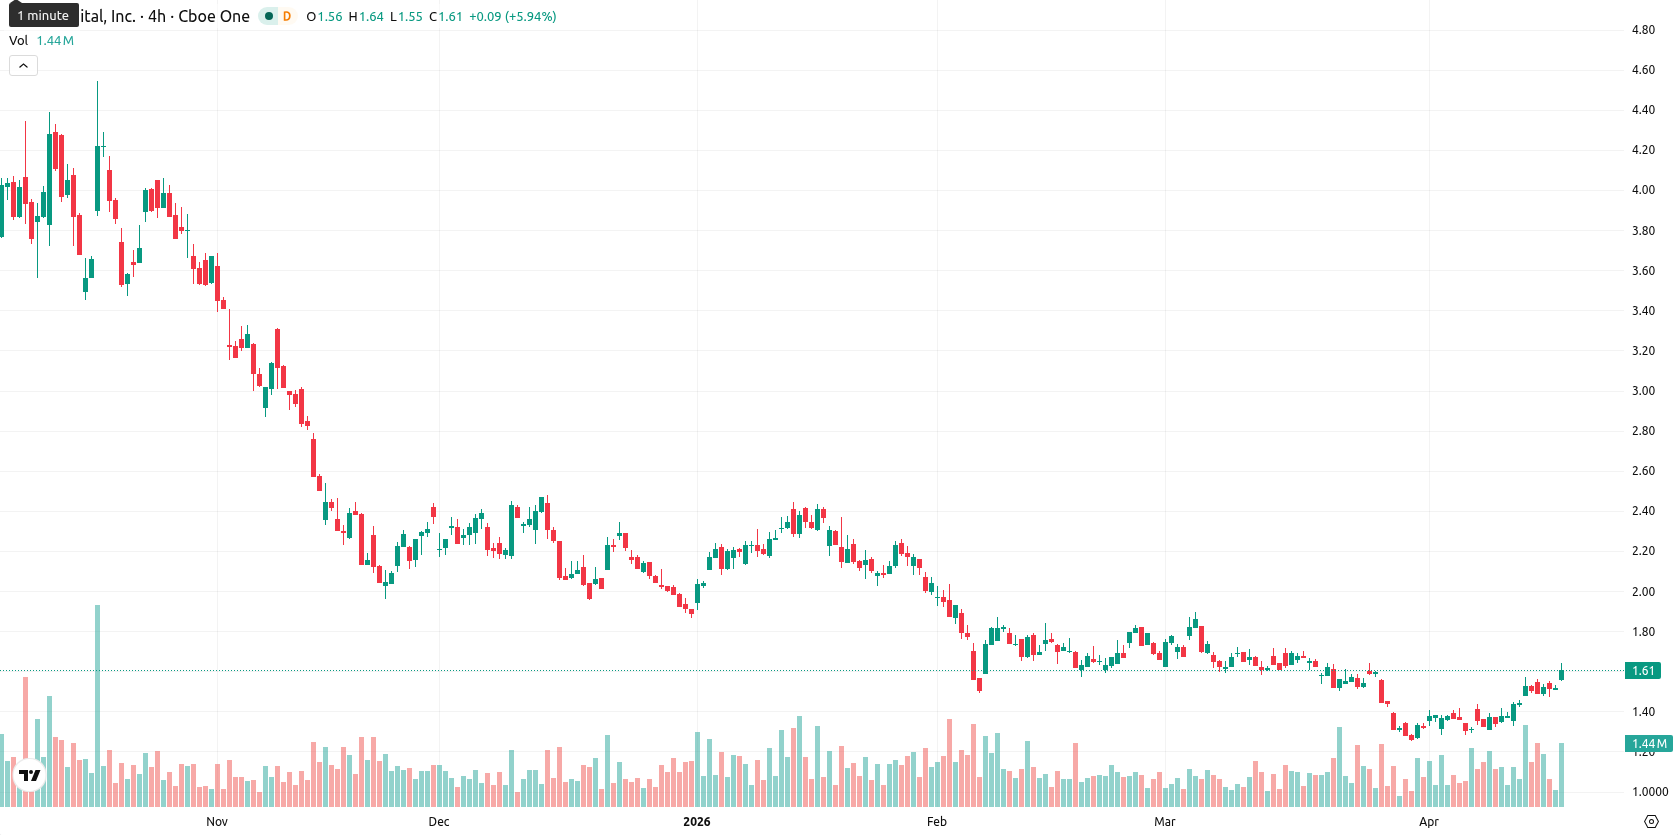
Bit Digital stock price forecast: Watching $1.52–$1.77 range as BTBT jumps 5.92%

Bit Digital Inc (BTBT) is trading at $1.61, positioning above its SMA-20 ($1.43) but only slightly above its SMA-50 ($1.59), while remaining well below its SMA-200 ($2.53). This setup signals short-term strength but persistent medium- and long-term bearish pressure, with the Ichimoku Kijun at $1.49 acting as immediate support.
Highlights
- BTBT shows short-term strength, trading above its 20-day average but remains in a longer-term bearish trend.
- Momentum signals are mixed, with overbought intraday conditions and weak, indecisive trend indications from most oscillators.
- Price is likely to consolidate between $1.52 and $1.77 over the coming week, with further upside seen as unlikely.
Oscillator divergence widens as intraday strength meets trend weakness
Momentum indicators show a mixed picture: MACD gives a strong sell signal on the daily chart, while ADX is low at 17.39, indicating trend weakness. Daily RSI (51.98) and CCI (50.50) are neutral to positive, but Stoch RSI (96.63) signals an overbought condition, emphasizing the risk of a pullback. BBP is positive, suggesting buyers dominate intraday momentum. The Awesome Oscillator is neutral, offering no strong confirmation for either direction. The session opened with a narrow gap up and the current price sits near today's peak ($1.55 — $1.64), indicating strong upward action and moderate volatility. There is notable divergence between oscillators, with intraday performance showing strength toward the highs despite mixed longer-term momentum signals.
Consolidation likely as downside risk outweighs bullish scenario
For the next five trading days, the expected price range for BTBT is $1.52 to $1.77, keeping the current price within a typical weekly volatility band relative to current levels. The probability of further price increases is very low (less than 20%), making additional downside more likely. Baseline scenario: the price consolidates sideways within the $1.52 — $1.77 corridor. Bullish scenario: a sustained move above $1.77 could trigger further gains if buying pressure intensifies. Bearish scenario: a break below the $1.52 support may signal renewed downward momentum in line with prevailing medium- and long-term technical signals.
Earlier, analysts noted that Bit Digital was exhibiting short-term strength but faced persistent medium- and long-term bearish pressure, with volatility expected to remain elevated. The latest analysis confirms this mixed outlook, highlighting sideways consolidation as the prevailing scenario and spotlighting $1.52 as a critical level for any potential downside momentum.


Latest Bit Digital News


-
 Afghanistan
-
 Albania
-
 Algeria
-
 Angola
-
 Argentina
-
 Armenia
-
 Australia
-
 Austria
-
 Azerbaijan
-
 Bahamas
-
 Bahrain
-
 Bangladesh
-
 Belarus
-
 Belgium
-
 Bolivia
-
 Botswana
-
 Brazil
-
 Brunei
-
 Bulgaria
-
 Cambodia
-
 Cameroon
-
 Canada
-
 Chile
Chile
-
 China
China
-
 Colombia
-
 Congo
Congo
-
 Costa Rica
-
 Cote d'Ivoire
-
 Croatia
-
 Cuba
Cuba
-
 Cyprus
-
 Czechia
-
 DR Congo
-
 Denmark
-
 Dominican Republic
-
 Ecuador
-
 Egypt
Egypt
-
 El Salvador
-
 Estonia
-
 Eswatini
-
 Ethiopia
-
 Finland
-
 France
-
 Georgia
-
 Germany
-
 Ghana
Ghana
-
 Greece
-
 Haiti
Haiti
-
 Hong Kong
-
 Hungary
-
 India
India
-
 Indonesia
-
 Iran, Islamic republic
-
 Iraq
Iraq
-
 Ireland
-
 Israel
-
 Italy
Italy
-
 Jamaica
-
 Japan
Japan
-
 Jordan
-
 Kazakhstan
-
 Kenya
Kenya
-
 Korea
Korea
-
 Kuwait
-
 Kyrgyzstan
-
 Laos
Laos
-
 Latvia
-
 Lebanon
-
 Lesotho
-
 Libya
Libya
-
 Lithuania
-
 Luxembourg
-
 Madagascar
-
 Malaysia
-
 Malta
Malta
-
 Mauritius
-
 Mexico
-
 Moldova
-
 Mongolia
-
 Montenegro
-
 Morocco
-
 Mozambique
-
 Myanmar
-
 Namibia
-
 Nepal
Nepal
-
 Netherlands
-
 New Zealand
-
 Nigeria
-
 North Macedonia
-
 Norway
-
 Oman
Oman
-
 Pakistan
-
 Palestine
-
 Panama
-
 Papua New Guinea
-
 Paraguay
-
 Peru
Peru
-
 Philippines
-
 Poland
-
 Portugal
-
 Puerto Rico
-
 Qatar
Qatar
-
 Reunion
-
 Romania
-
 Rwanda
-
 Saudi Arabia
-
 Serbia
-
 Singapore
-
 Slovakia
-
 Slovenia
-
 Somalia
-
 South Africa
-
 Spain
Spain
-
 Sri Lanka
-
 Sweden
-
 Switzerland
-
 Syria
Syria
-
 Taiwan
-
 Tajikistan
-
 Tanzania
-
 Thailand
-
 Trinidad and Tobago
-
 Tunisia
-
 Turkey
-
 UAE
UAE
-
 Uganda
-
 Ukraine
-
 United Kingdom
-
United States
-
 Uruguay
-
 Uzbekistan
-
 Venezuela
-
 Vietnam
-
 Yemen
Yemen
-
 Zambia
-
 Zimbabwe
- Forex
- Crypto
