
Overbought levels pause NuCana stock advance near recent highs

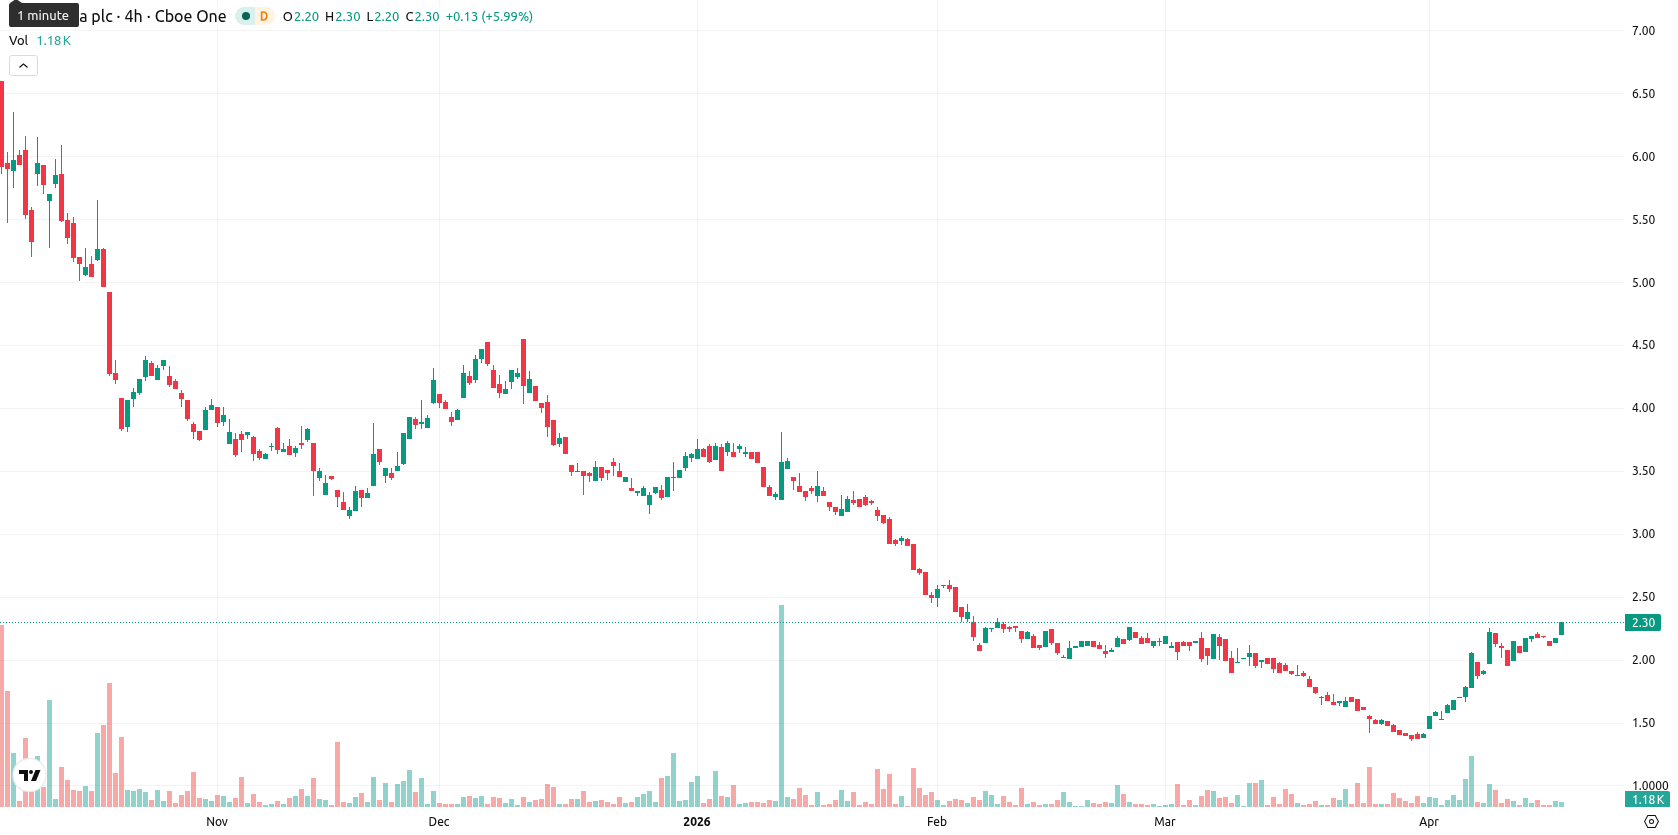
NuCana plc ADR (NCNA) is trading at $2.27, up 6.57% for the day. The price stands above both the SMA-20 ($1.76) and SMA-50 ($1.95), but remains significantly below the long-term SMA-200 ($4.21), reflecting positive short- and medium-term momentum while long-term sentiment continues to lean bearish. The Ichimoku Kijun level on the daily chart is $1.80, acting as the nearest support.
Highlights
- NCNA is exhibiting short- and medium-term bullish momentum but remains in a broader long-term downtrend.
- Momentum indicators show strength, yet overbought oscillators signal increasing risk of a near-term pullback if buying persists.
- The price is expected to consolidate between $2.05 and $2.49, with a move below $2.05 exposing further downside risk.
Overbought signals emerge as momentum diverges from trend strength
On the daily chart, NCNA shows constructive momentum, with a neutral MACD and a firm ADX reading of 31.61 that points to a strong underlying trend. Oscillators indicate caution: Stoch RSI is overbought at 94.37, CCI is elevated at 106.30, and RSI sits at 58.47, suggesting further space before reaching overbought territory. BBP is positive at 0.25, indicating buyers remain dominant intraday, and the Awesome Oscillator supports the current upward tone. The price opened at $2.27 with a minor gap up from the previous close of $2.13, currently trading near session highs amid high volatility and strong upward momentum. Divergence between momentum indicators and overbought oscillators may signal hesitation if persistent buying continues without a consolidation pause.
Sideways consolidation likely as long-term resistance constrains upside
For the coming week, NCNA is expected to trade within a volatility band of $2.05 to $2.49 relative to current levels. The probability of a further price increase is very low (under 20%), as longer-term signals such as the weekly MA-50, MACD, and RSI remain bearish, despite a strong directional ADX on the weekly chart. The baseline scenario points to sideways consolidation within this range. A breakout above $2.49 may fuel further gains, while a drop below $2.05 would expose NCNA to renewed downside, as long-term resistance remains intact.
Earlier, analysts noted that NuCana was exhibiting short-term bullish momentum amid cautionary overbought signals and an ongoing bearish long-term outlook. The current momentum and elevated oscillators reinforce this careful stance, with attention now focused on whether the price can sustain above $2.05 support or trigger a breakout beyond $2.49 resistance in the coming sessions.


Latest NuCana News


-
 Afghanistan
-
 Albania
-
 Algeria
-
 Angola
-
 Argentina
-
 Armenia
-
 Australia
-
 Austria
-
 Azerbaijan
-
 Bahamas
-
 Bahrain
-
 Bangladesh
-
 Belarus
-
 Belgium
-
 Bolivia
-
 Botswana
-
 Brazil
-
 Brunei
-
 Bulgaria
-
 Cambodia
-
 Cameroon
-
 Canada
-
 Chile
Chile
-
 China
China
-
 Colombia
-
 Congo
Congo
-
 Costa Rica
-
 Cote d'Ivoire
-
 Croatia
-
 Cuba
Cuba
-
 Cyprus
-
 Czechia
-
 DR Congo
-
 Denmark
-
 Dominican Republic
-
 Ecuador
-
 Egypt
Egypt
-
 El Salvador
-
 Estonia
-
 Eswatini
-
 Ethiopia
-
 Finland
-
 France
-
 Georgia
-
 Germany
-
 Ghana
Ghana
-
 Greece
-
 Haiti
Haiti
-
 Hong Kong
-
 Hungary
-
 India
India
-
 Indonesia
-
 Iran, Islamic republic
-
 Iraq
Iraq
-
 Ireland
-
 Israel
-
 Italy
Italy
-
 Jamaica
-
 Japan
Japan
-
 Jordan
-
 Kazakhstan
-
 Kenya
Kenya
-
 Korea
Korea
-
 Kuwait
-
 Kyrgyzstan
-
 Laos
Laos
-
 Latvia
-
 Lebanon
-
 Lesotho
-
 Libya
Libya
-
 Lithuania
-
 Luxembourg
-
 Madagascar
-
 Malaysia
-
 Malta
Malta
-
 Mauritius
-
 Mexico
-
 Moldova
-
 Mongolia
-
 Montenegro
-
 Morocco
-
 Mozambique
-
 Myanmar
-
 Namibia
-
 Nepal
Nepal
-
 Netherlands
-
 New Zealand
-
 Nigeria
-
 North Macedonia
-
 Norway
-
 Oman
Oman
-
 Pakistan
-
 Palestine
-
 Panama
-
 Papua New Guinea
-
 Paraguay
-
 Peru
Peru
-
 Philippines
-
 Poland
-
 Portugal
-
 Puerto Rico
-
 Qatar
Qatar
-
 Reunion
-
 Romania
-
 Rwanda
-
 Saudi Arabia
-
 Serbia
-
 Singapore
-
 Slovakia
-
 Slovenia
-
 Somalia
-
 South Africa
-
 Spain
Spain
-
 Sri Lanka
-
 Sweden
-
 Switzerland
-
 Syria
Syria
-
 Taiwan
-
 Tajikistan
-
 Tanzania
-
 Thailand
-
 Trinidad and Tobago
-
 Tunisia
-
 Turkey
-
 UAE
UAE
-
 Uganda
-
 Ukraine
-
 United Kingdom
-
United States
-
 Uruguay
-
 Uzbekistan
-
 Venezuela
-
 Vietnam
-
 Yemen
Yemen
-
 Zambia
-
 Zimbabwe
- Forex
- Crypto
