
GOOGL shares trade near top of recent range supported by strong dynamic support: weekly report

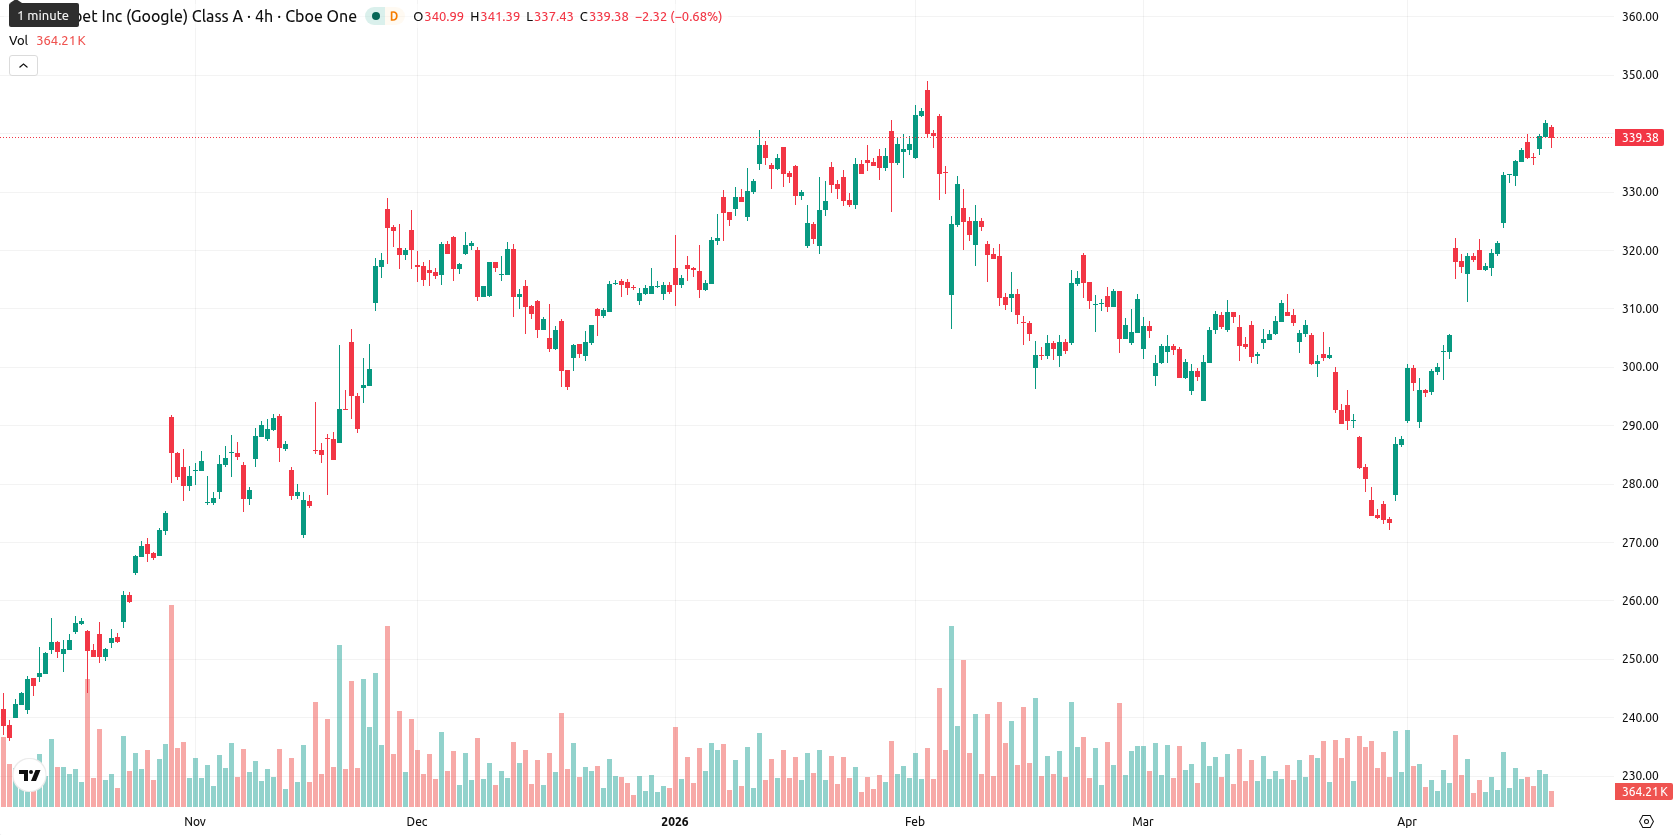
Alphabet Inc. (GOOGL) slipped $2.40 (0.52%) over the past week but continues to trade well above the weekly MA-20 ($313.84), MA-50 ($256.17), and MA-200 ($167.82), reinforcing its strong bullish trend on the weekly timeframe. The price action remains near the top of the weekly range, with the asset consolidating above all key moving averages.
Highlights
- GOOGL maintains a strong bullish technical structure, consistently trading above key moving averages in both medium and long-term timeframes.
- Momentum indicators signal strong buyer dominance, but overbought conditions suggest the current run is consolidating near highs.
- GOOGL is expected to trade between $322.00 and $352.00 over the next week, with a 75% probability of further gains unless support at $322.00 breaks.
AI integration and enterprise growth bolster sentiment during the week
Google introduced a new Chrome feature called 'Skills', allowing users to save and reuse AI prompts and enhancing integration with Gemini alongside improved security features. The company reported ongoing robust growth in its core and AI-driven businesses, with Google Cloud and Gemini seeing rapid adoption and Cloud revenue rising 48% year-over-year. Strategic partnerships, such as the collaboration with Thoma Bravo, are further expanding Google's AI and enterprise offerings.
Bullish momentum sustained as weekly signals flag overbought risk
Weekly technicals show GOOGL trading well above all key W1 moving averages, with the Ichimoku Kijun at $296.58 acting as distant dynamic support below the current price. The MA-20 at $313.84 serves as the closest dynamic support, while volatility for the week reached 5.72%. Momentum remains broadly bullish with MACD signaling Strong Buy and ADX confirming sustained buyer strength. Oscillators are mixed: RSI supports further upside, but CCI and Bull/Bear Power both indicate overbought conditions and strong bullish dominance, while the Awesome Oscillator and Stochastic RSI are neutral. Key support is seen at $322.00 and resistance at $352.00 on the weekly chart.
Tight range expected as upside breakout and pullback risks persist
Over the next 5 trading days, GOOGL is likely to consolidate within a range of $322.00 to $352.00, in line with weekly volatility and price structure. Three out of four primary weekly indicators suggest continued buying interest, supporting a roughly 75% probability of further gains. While a sideways movement near current highs is the baseline scenario, a break above $352.00 may trigger renewed upside momentum. Conversely, a drop below $322.00 could open the door to a short-term pullback.
Earlier, analysts noted that Alphabet’s uptrend remained intact, supported by ongoing advancements in AI and strong bullish momentum despite intermittent pullbacks. The continued outperformance above all key weekly moving averages and robust growth in AI-driven businesses reinforce the bullish outlook, with traders advised to monitor the $352.00 resistance level as a potential trigger for further upside.


-
 Afghanistan
-
 Albania
-
 Algeria
-
 Angola
-
 Argentina
-
 Armenia
-
 Australia
-
 Austria
-
 Azerbaijan
-
 Bahamas
-
 Bahrain
-
 Bangladesh
-
 Belarus
-
 Belgium
-
 Bolivia
-
 Botswana
-
 Brazil
-
 Brunei
-
 Bulgaria
-
 Cambodia
-
 Cameroon
-
 Canada
-
 Chile
Chile
-
 China
China
-
 Colombia
-
 Congo
Congo
-
 Costa Rica
-
 Cote d'Ivoire
-
 Croatia
-
 Cuba
Cuba
-
 Cyprus
-
 Czechia
-
 DR Congo
-
 Denmark
-
 Dominican Republic
-
 Ecuador
-
 Egypt
Egypt
-
 El Salvador
-
 Estonia
-
 Eswatini
-
 Ethiopia
-
 Finland
-
 France
-
 Georgia
-
 Germany
-
 Ghana
Ghana
-
 Greece
-
 Haiti
Haiti
-
 Hong Kong
-
 Hungary
-
 India
India
-
 Indonesia
-
 Iran, Islamic republic
-
 Iraq
Iraq
-
 Ireland
-
 Israel
-
 Italy
Italy
-
 Jamaica
-
 Japan
Japan
-
 Jordan
-
 Kazakhstan
-
 Kenya
Kenya
-
 Korea
Korea
-
 Kuwait
-
 Kyrgyzstan
-
 Laos
Laos
-
 Latvia
-
 Lebanon
-
 Lesotho
-
 Libya
Libya
-
 Lithuania
-
 Luxembourg
-
 Madagascar
-
 Malaysia
-
 Malta
Malta
-
 Mauritius
-
 Mexico
-
 Moldova
-
 Mongolia
-
 Montenegro
-
 Morocco
-
 Mozambique
-
 Myanmar
-
 Namibia
-
 Nepal
Nepal
-
 Netherlands
-
 New Zealand
-
 Nigeria
-
 North Macedonia
-
 Norway
-
 Oman
Oman
-
 Pakistan
-
 Palestine
-
 Panama
-
 Papua New Guinea
-
 Paraguay
-
 Peru
Peru
-
 Philippines
-
 Poland
-
 Portugal
-
 Puerto Rico
-
 Qatar
Qatar
-
 Reunion
-
 Romania
-
 Rwanda
-
 Saudi Arabia
-
 Serbia
-
 Singapore
-
 Slovakia
-
 Slovenia
-
 Somalia
-
 South Africa
-
 Spain
Spain
-
 Sri Lanka
-
 Sweden
-
 Switzerland
-
 Syria
Syria
-
 Taiwan
-
 Tajikistan
-
 Tanzania
-
 Thailand
-
 Trinidad and Tobago
-
 Tunisia
-
 Turkey
-
 UAE
UAE
-
 Uganda
-
 Ukraine
-
 United Kingdom
-
United States
-
 Uruguay
-
 Uzbekistan
-
 Venezuela
-
 Vietnam
-
 Yemen
Yemen
-
 Zambia
-
 Zimbabwe
- Forex
- Crypto
