
Microsoft stock trades in upper recent range as RSI signals a bearish tone: weekly report

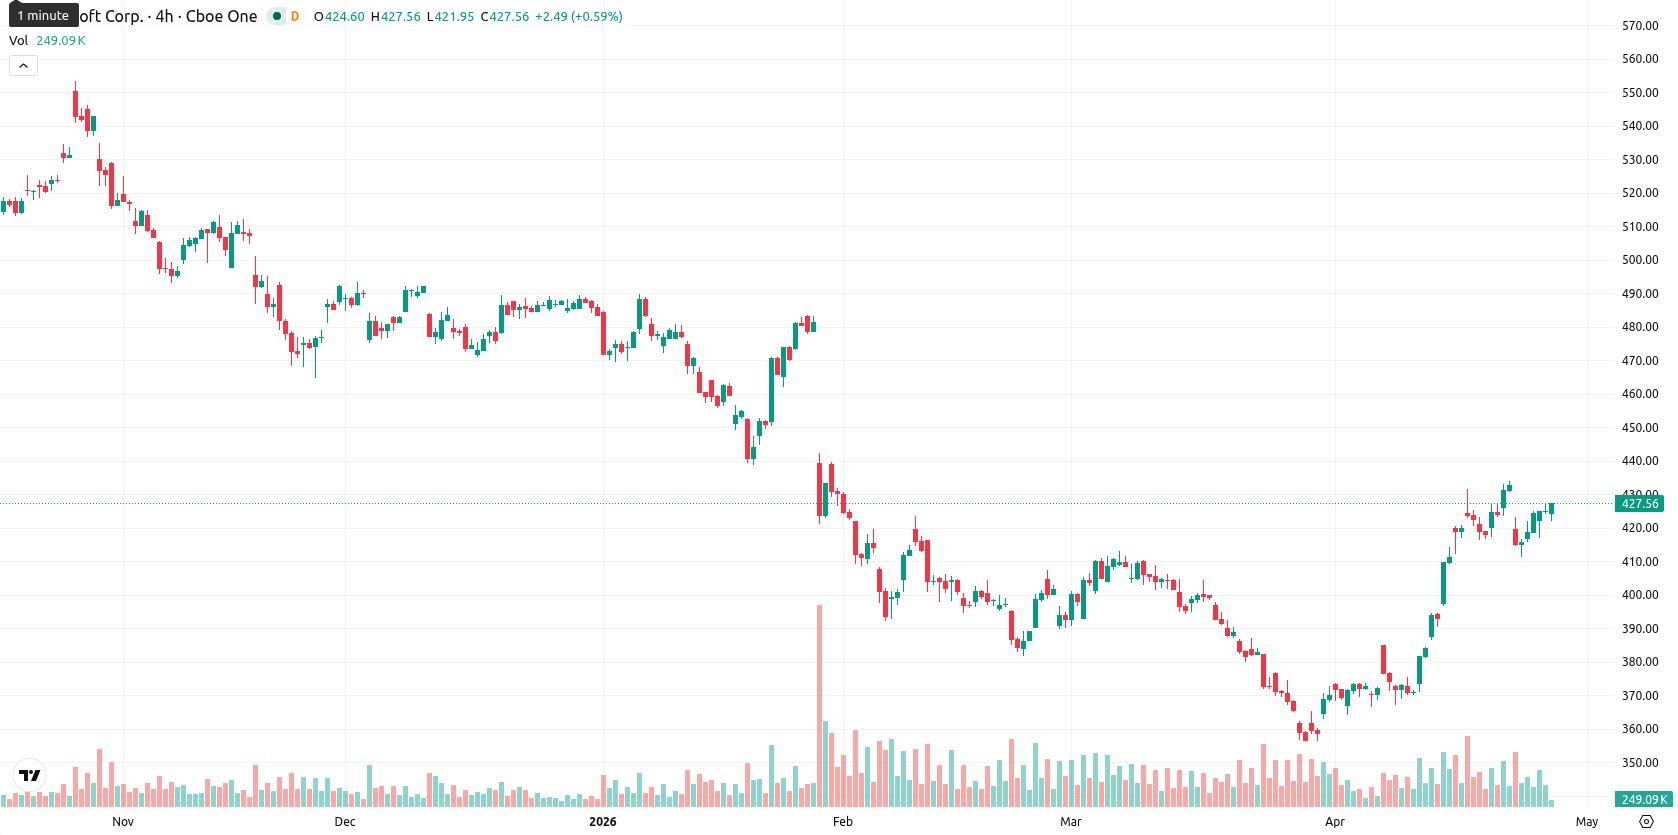
Microsoft Corporation (MSFT) is currently trading at $426.68, which puts it above both its weekly MA-20 ($421.63) and MA-200 ($381.82), but still trading below the weekly MA-50 ($468.34). Over the past week, Microsoft gained $2.22, a 0.52% increase, holding in the upper part of the recent weekly range and showing persistent volatility at 5.42%.
Highlights
- Microsoft trades in a medium-term bullish structure but is capped by strong resistance and displays signs of trend exhaustion.
- Mixed momentum signals, with overbought indications and weak trend confirmation, suggest increasing risk of a reversal as buyers lose steam.
- For the next week, Microsoft is likely to remain range-bound between $411.50 and $442.00, with a greater probability of a downward move.
Strategic partnership overhaul shapes market focus ahead of earnings
On April 27, 2026, Microsoft and OpenAI announced key revisions to their partnership, ending Microsoft's exclusive rights to sell OpenAI's AI models and allowing OpenAI to offer its technology to other major cloud providers. The updated agreement also modifies the existing revenue-sharing arrangement, while Microsoft retains a license for OpenAI’s intellectual property and benefits from Azure-first launches until 2032. These changes were announced days before Microsoft's Q3 FY2026 earnings report, which is anticipated to clarify the agreement's financial impact.
Mixed momentum as uptrend persists but technical signals diverge this week
Technical analysis on the weekly (W1) timeframe reveals mixed momentum signals for Microsoft. The price sits above the MA-20 and MA-200, confirming a medium- and long-term uptrend, but remains capped below the MA-50. Weekly MACD and ADX indicate weakness, while the Stochastic RSI and Bull/Bear Power oscillators flash overbought readings with strong buying activity. Conversely, the RSI on W1 signals a bearish tone and the CCI points to neutral momentum. Current weekly support is seen near $411.50, with resistance around $442.00, and volatility remains elevated at 5.42%.
Low breakout risk as indicators favor sideways or corrective move
For the next 7 trading days, Microsoft is likely to move within a sideways range of $411.50 to $442.00 based on weekly technical signals. The probability of a breakout above $442.00 is low (less than 20%), as none of the four primary indicators currently signal a buy, increasing the chances for a corrective or sideways move. A bullish scenario would require a sustained momentum push and a close above resistance, potentially targeting a short-term rally. Conversely, a break below $411.50 could accelerate downside action as weekly bearish momentum intensifies.
Earlier, analysts noted that Microsoft was entering a phase of heightened competition in AI after restructuring its partnership with OpenAI, shifting the focus to proving AI’s profitability rather than exclusivity. The current technical landscape reinforces this perspective, highlighting that traders should monitor $411.50 as a key support level amid increased volatility and evolving fundamentals.


Latest Microsoft News


-
 Afghanistan
-
 Albania
-
 Algeria
-
 Angola
-
 Argentina
-
 Armenia
-
 Australia
-
 Austria
-
 Azerbaijan
-
 Bahamas
-
 Bahrain
-
 Bangladesh
-
 Belarus
-
 Belgium
-
 Bolivia
-
 Botswana
-
 Brazil
-
 Brunei
-
 Bulgaria
-
 Cambodia
-
 Cameroon
-
 Canada
-
 Chile
Chile
-
 China
China
-
 Colombia
-
 Congo
Congo
-
 Costa Rica
-
 Cote d'Ivoire
-
 Croatia
-
 Cuba
Cuba
-
 Cyprus
-
 Czechia
-
 DR Congo
-
 Denmark
-
 Dominican Republic
-
 Ecuador
-
 Egypt
Egypt
-
 El Salvador
-
 Estonia
-
 Eswatini
-
 Ethiopia
-
 Finland
-
 France
-
 Georgia
-
 Germany
-
 Ghana
Ghana
-
 Greece
-
 Haiti
Haiti
-
 Hong Kong
-
 Hungary
-
 India
India
-
 Indonesia
-
 Iran, Islamic republic
-
 Iraq
Iraq
-
 Ireland
-
 Israel
-
 Italy
Italy
-
 Jamaica
-
 Japan
Japan
-
 Jordan
-
 Kazakhstan
-
 Kenya
Kenya
-
 Korea
Korea
-
 Kuwait
-
 Kyrgyzstan
-
 Laos
Laos
-
 Latvia
-
 Lebanon
-
 Lesotho
-
 Libya
Libya
-
 Lithuania
-
 Luxembourg
-
 Madagascar
-
 Malaysia
-
 Malta
Malta
-
 Mauritius
-
 Mexico
-
 Moldova
-
 Mongolia
-
 Montenegro
-
 Morocco
-
 Mozambique
-
 Myanmar
-
 Namibia
-
 Nepal
Nepal
-
 Netherlands
-
 New Zealand
-
 Nigeria
-
 North Macedonia
-
 Norway
-
 Oman
Oman
-
 Pakistan
-
 Palestine
-
 Panama
-
 Papua New Guinea
-
 Paraguay
-
 Peru
Peru
-
 Philippines
-
 Poland
-
 Portugal
-
 Puerto Rico
-
 Qatar
Qatar
-
 Reunion
-
 Romania
-
 Rwanda
-
 Saudi Arabia
-
 Serbia
-
 Singapore
-
 Slovakia
-
 Slovenia
-
 Somalia
-
 South Africa
-
 Spain
Spain
-
 Sri Lanka
-
 Sweden
-
 Switzerland
-
 Syria
Syria
-
 Taiwan
-
 Tajikistan
-
 Tanzania
-
 Thailand
-
 Trinidad and Tobago
-
 Tunisia
-
 Turkey
-
 UAE
UAE
-
 Uganda
-
 Ukraine
-
 United Kingdom
-
United States
-
 Uruguay
-
 Uzbekistan
-
 Venezuela
-
 Vietnam
-
 Yemen
Yemen
-
 Zambia
-
 Zimbabwe
- Forex
- Crypto
