
Sundial Growers stock price forecast: Support at $1.40 as SNDL falls 2.65%

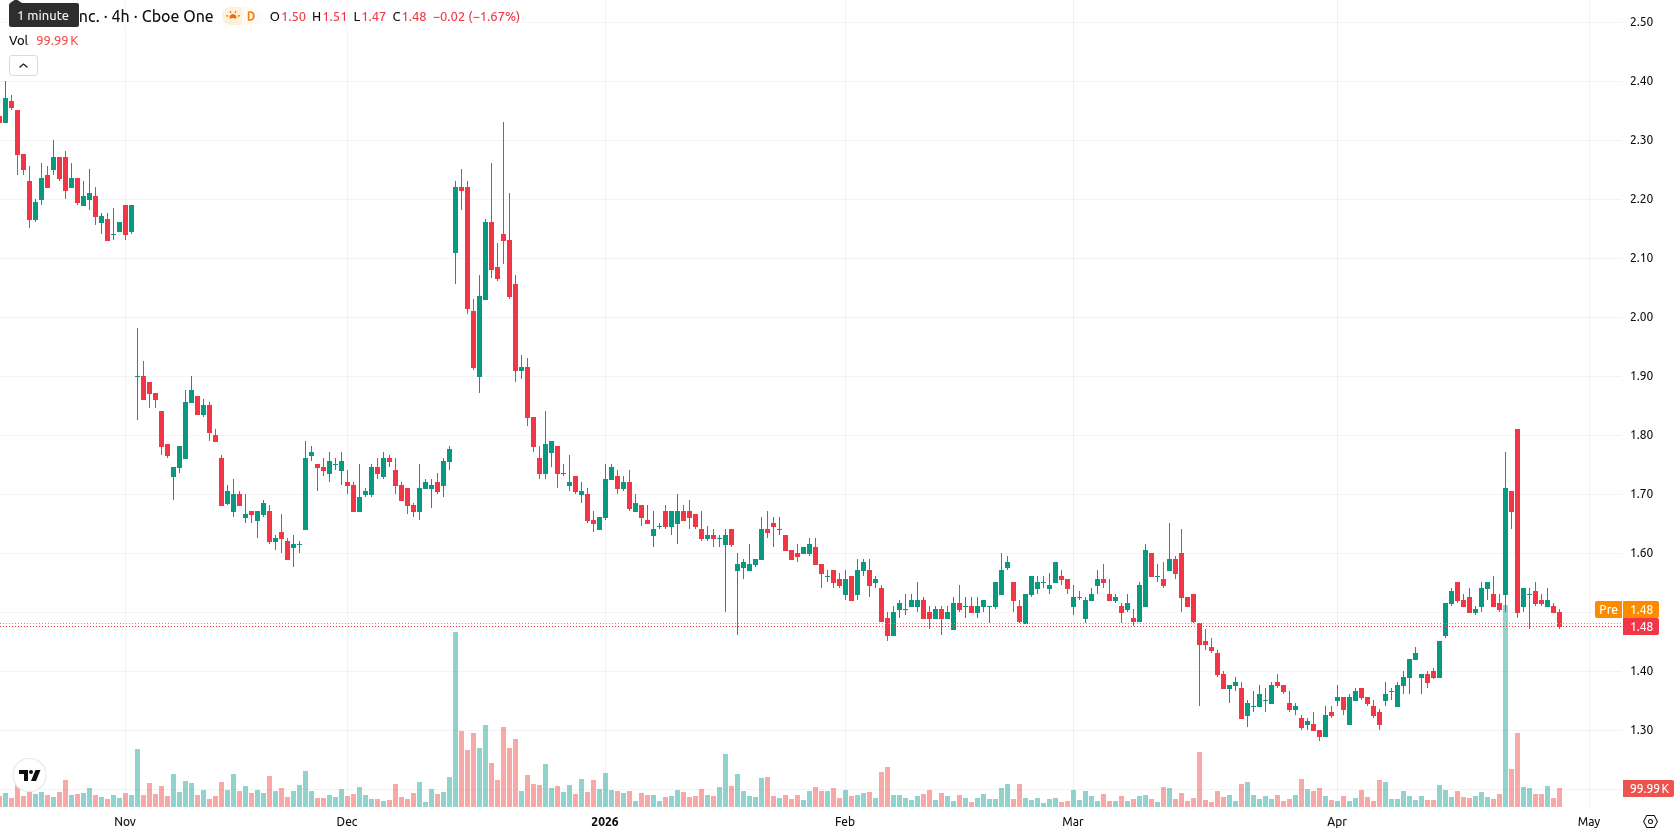
Sundial Growers Inc. (SNDL) is trading at $1.47, registering a daily decline of 2.65%. The current price sits just above its key short-term moving averages but remains well below the long-term trend level.
Highlights
- SNDL trades in a narrow $1.45–$1.52 range, showing mild short-term support but persistent long-term bearish sentiment.
- Technical indicators are mixed, with momentum suggesting modest upside but oscillators highlighting ongoing uncertainty and weak trend strength.
- Breakout probability above $1.55 is very low; a drop below $1.45 could trigger further downside toward $1.40 short term.
Mixed momentum and resistance define near-term trading range
On the technical side, SNDL is positioned just above the SMA-20 at $1.45 and SMA-50 at $1.46, while still trading far below the SMA-200 at $1.84. The Ichimoku Kijun resistance level is $1.55, marking immediate overhead resistance. Momentum indicators are mixed: MACD D1 shows a buy signal, ADX is at 24.22 indicating moderate upward momentum, and RSI D1 is neutral to slightly bullish at 50.17. Stoch RSI and CCI are both near oversold ranges, while BBP points to a slight intraday buyer advantage, though underlying oscillator signals do not agree, reflecting short-term uncertainty.
Volatility zone narrows as momentum stabilizes near key levels
Over the next five trading days, SNDL is likely to trade within a typical volatility band between $1.45 and $1.52. An upward move above $1.55 could open a path for a test of $1.60, while a break below $1.45 may attract further downside toward the $1.40 area as momentum stabilizes.
Earlier, analysts noted that Sundial Growers was exhibiting short- to medium-term resilience, but remained capped by longer-term resistance and mixed technical momentum. With the latest price action continuing to reflect this indecision, traders should closely monitor price behavior around $1.45 and $1.55 for potential shifts in directional momentum.


-
 Afghanistan
-
 Albania
-
 Algeria
-
 Angola
-
 Argentina
-
 Armenia
-
 Australia
-
 Austria
-
 Azerbaijan
-
 Bahamas
-
 Bahrain
-
 Bangladesh
-
 Belarus
-
 Belgium
-
 Bolivia
-
 Botswana
-
 Brazil
-
 Brunei
-
 Bulgaria
-
 Cambodia
-
 Cameroon
-
 Canada
-
 Chile
Chile
-
 China
China
-
 Colombia
-
 Congo
Congo
-
 Costa Rica
-
 Cote d'Ivoire
-
 Croatia
-
 Cuba
Cuba
-
 Cyprus
-
 Czechia
-
 DR Congo
-
 Denmark
-
 Dominican Republic
-
 Ecuador
-
 Egypt
Egypt
-
 El Salvador
-
 Estonia
-
 Eswatini
-
 Ethiopia
-
 Finland
-
 France
-
 Georgia
-
 Germany
-
 Ghana
Ghana
-
 Greece
-
 Haiti
Haiti
-
 Hong Kong
-
 Hungary
-
 India
India
-
 Indonesia
-
 Iran, Islamic republic
-
 Iraq
Iraq
-
 Ireland
-
 Israel
-
 Italy
Italy
-
 Jamaica
-
 Japan
Japan
-
 Jordan
-
 Kazakhstan
-
 Kenya
Kenya
-
 Korea
Korea
-
 Kuwait
-
 Kyrgyzstan
-
 Laos
Laos
-
 Latvia
-
 Lebanon
-
 Lesotho
-
 Libya
Libya
-
 Lithuania
-
 Luxembourg
-
 Madagascar
-
 Malaysia
-
 Malta
Malta
-
 Mauritius
-
 Mexico
-
 Moldova
-
 Mongolia
-
 Montenegro
-
 Morocco
-
 Mozambique
-
 Myanmar
-
 Namibia
-
 Nepal
Nepal
-
 Netherlands
-
 New Zealand
-
 Nigeria
-
 North Macedonia
-
 Norway
-
 Oman
Oman
-
 Pakistan
-
 Palestine
-
 Panama
-
 Papua New Guinea
-
 Paraguay
-
 Peru
Peru
-
 Philippines
-
 Poland
-
 Portugal
-
 Puerto Rico
-
 Qatar
Qatar
-
 Reunion
-
 Romania
-
 Rwanda
-
 Saudi Arabia
-
 Serbia
-
 Singapore
-
 Slovakia
-
 Slovenia
-
 Somalia
-
 South Africa
-
 Spain
Spain
-
 Sri Lanka
-
 Sweden
-
 Switzerland
-
 Syria
Syria
-
 Taiwan
-
 Tajikistan
-
 Tanzania
-
 Thailand
-
 Trinidad and Tobago
-
 Tunisia
-
 Turkey
-
 UAE
UAE
-
 Uganda
-
 Ukraine
-
 United Kingdom
-
United States
-
 Uruguay
-
 Uzbekistan
-
 Venezuela
-
 Vietnam
-
 Yemen
Yemen
-
 Zambia
-
 Zimbabwe
- Forex
- Crypto
