
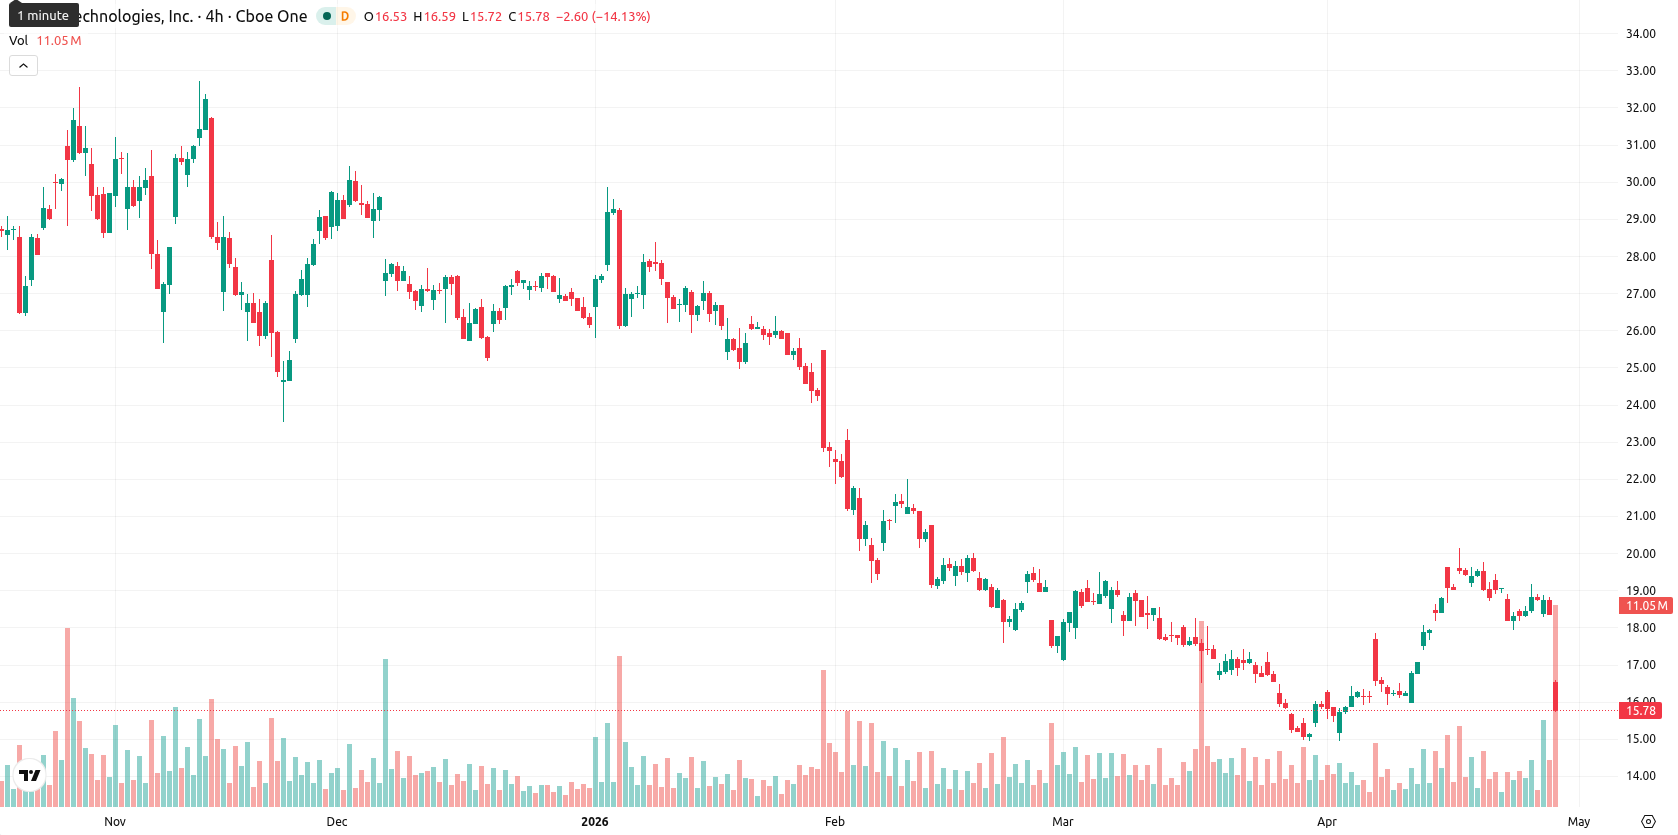
-14.18% for SoFi stock as broader selling pressure weighs on shares

SoFi Technologies, Inc (SOFI) is trading at $15.73 after a daily decline of 14.18%. The stock currently sits well below its key moving averages.
Highlights
- SoFi reported $1.1 billion in adjusted net revenue for Q1 2026, up over 40% year over year, and maintained full-year guidance.
- Technology platform segment revenue fell 27% to $75 million, prompting planned branding and go-to-market changes later in 2026.
- SOFI trades well below key moving averages with strong selling pressure, an expected $14.90–$15.75 range, and a bearish trend dominant.
Mixed platform results and steady guidance weigh on sentiment
SoFi Technologies reported first-quarter 2026 results with adjusted net revenue reaching $1.1 billion, an increase of approximately 41–43% year over year. The company met expectations with earnings per share at $0.12, added 1.1 million new members for a total of 14.7 million, and saw total products grow to 22.2 million. Despite record loan originations of $12.18 billion and continued revenue growth, SoFi reaffirmed its prior full-year 2026 guidance without raising targets, and its technology platform segment saw a 27% revenue decline to $75 million. The company also announced plans to launch a unified tech platform brand and restructure its go-to-market strategy later in 2026, though price action has remained under broader selling pressure.
Neutral momentum contrasts with resistance as technical ceilings persist
MA-20, MA-50, and MA-200 are at $17.61, $17.81, and $23.84, respectively, all positioned above the current price. The Ichimoku Kijun level on the daily timeframe is $17.53, serving as immediate resistance, while support is seen near $14.90. Momentum indicators deliver contrasting signals: MACD and ADX on the daily chart show moderate bullish tendencies, whereas RSI is neutral at 53, and both Stoch RSI and CCI remain neutral. BBP registers an overbought condition with a positive value, indicating lingering buyer interest despite strong selling pressure following a sharp gap down at the open.
Sideways trading expected as upside reversal remains unlikely
Over the next five sessions, SOFI is expected to trade within a typical volatility band from $14.90 to $15.75. The probability of a move higher is very low, and sideways action within this corridor is the baseline scenario. A sustained break above $17.53 would be required for any near-term bullish reversal, which currently appears unlikely. A close below $14.90 would confirm a bearish scenario and could trigger further downside momentum.
Earlier, analysts noted that while SoFi was benefiting from product innovation and improving short-term momentum, persistent selling pressure and technical resistance were capping further upside. The latest sharp decline beneath all major moving averages and muted momentum signals now elevate the risk of additional downside, making the $14.90 support level a critical threshold to watch for potential bearish continuation.


Latest SoFi News


-
 Afghanistan
-
 Albania
-
 Algeria
-
 Angola
-
 Argentina
-
 Armenia
-
 Australia
-
 Austria
-
 Azerbaijan
-
 Bahamas
-
 Bahrain
-
 Bangladesh
-
 Belarus
-
 Belgium
-
 Bolivia
-
 Botswana
-
 Brazil
-
 Brunei
-
 Bulgaria
-
 Cambodia
-
 Cameroon
-
 Canada
-
 Chile
Chile
-
 China
China
-
 Colombia
-
 Congo
Congo
-
 Costa Rica
-
 Cote d'Ivoire
-
 Croatia
-
 Cuba
Cuba
-
 Cyprus
-
 Czechia
-
 DR Congo
-
 Denmark
-
 Dominican Republic
-
 Ecuador
-
 Egypt
Egypt
-
 El Salvador
-
 Estonia
-
 Eswatini
-
 Ethiopia
-
 Finland
-
 France
-
 Georgia
-
 Germany
-
 Ghana
Ghana
-
 Greece
-
 Haiti
Haiti
-
 Hong Kong
-
 Hungary
-
 India
India
-
 Indonesia
-
 Iran, Islamic republic
-
 Iraq
Iraq
-
 Ireland
-
 Israel
-
 Italy
Italy
-
 Jamaica
-
 Japan
Japan
-
 Jordan
-
 Kazakhstan
-
 Kenya
Kenya
-
 Korea
Korea
-
 Kuwait
-
 Kyrgyzstan
-
 Laos
Laos
-
 Latvia
-
 Lebanon
-
 Lesotho
-
 Libya
Libya
-
 Lithuania
-
 Luxembourg
-
 Madagascar
-
 Malaysia
-
 Malta
Malta
-
 Mauritius
-
 Mexico
-
 Moldova
-
 Mongolia
-
 Montenegro
-
 Morocco
-
 Mozambique
-
 Myanmar
-
 Namibia
-
 Nepal
Nepal
-
 Netherlands
-
 New Zealand
-
 Nigeria
-
 North Macedonia
-
 Norway
-
 Oman
Oman
-
 Pakistan
-
 Palestine
-
 Panama
-
 Papua New Guinea
-
 Paraguay
-
 Peru
Peru
-
 Philippines
-
 Poland
-
 Portugal
-
 Puerto Rico
-
 Qatar
Qatar
-
 Reunion
-
 Romania
-
 Rwanda
-
 Saudi Arabia
-
 Serbia
-
 Singapore
-
 Slovakia
-
 Slovenia
-
 Somalia
-
 South Africa
-
 Spain
Spain
-
 Sri Lanka
-
 Sweden
-
 Switzerland
-
 Syria
Syria
-
 Taiwan
-
 Tajikistan
-
 Tanzania
-
 Thailand
-
 Trinidad and Tobago
-
 Tunisia
-
 Turkey
-
 UAE
UAE
-
 Uganda
-
 Ukraine
-
 United Kingdom
-
United States
-
 Uruguay
-
 Uzbekistan
-
 Venezuela
-
 Vietnam
-
 Yemen
Yemen
-
 Zambia
-
 Zimbabwe
- Forex
- Crypto
