
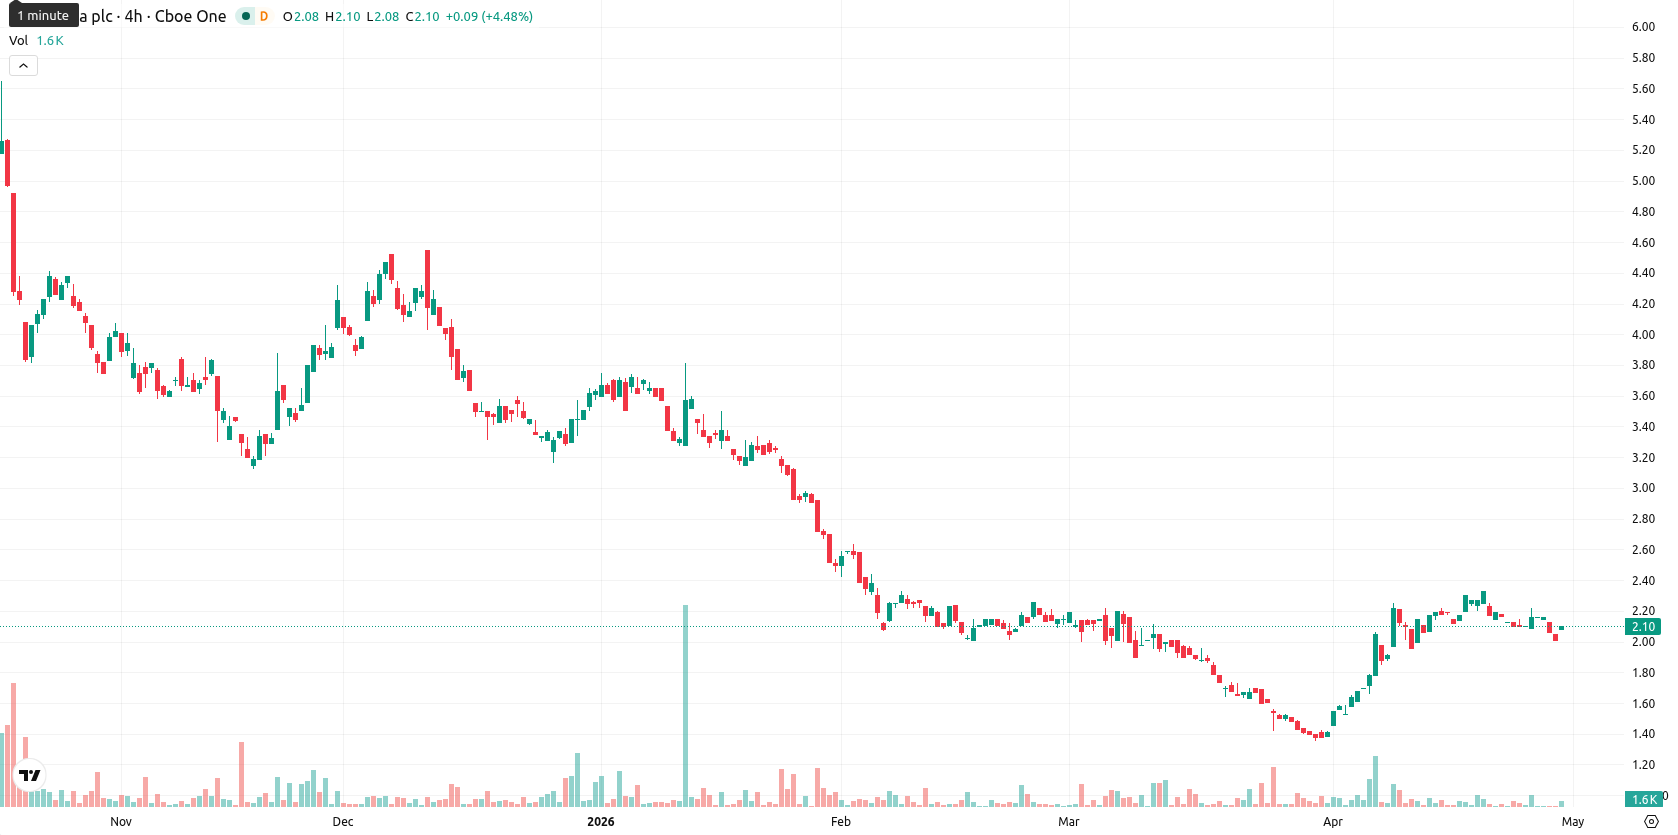
NuCana stock price forecast: $2.25 resistance as NCNA gains 3.92%

NuCana plc ADR (NCNA) is trading at $2.12, marking a daily gain of 3.92%. The stock is currently positioned just above its short-term moving averages, reflecting near-term upward momentum in the absence of longer-term trend confirmation.
Highlights
- NCNA shows short-term upward bias but remains under long-term seller pressure, trading below key resistance at $2.25.
- Bullish momentum indicators are contrasted by neutral and oversold oscillators, signaling divergences in the near-term price outlook.
- Sideways trading is projected in a $2.00–$2.25 range, with increased downside risk if support at $2.00 fails.
Bullish momentum divergence as technical levels define support
The 20-day moving average stands at $2.04, with the 50-day at $1.95 and the 200-day at $3.82, providing clear reference points for both support and resistance. Immediate technical support is identified at the Ichimoku Kijun level of $1.83. The MACD signals strong buy momentum, reinforced by an ADX reading of 25.94 (Buy), while the RSI at 50.33 remains neutral-to-supportive. The Stoch RSI indicates an oversold condition and the CCI is neutral, while Bull/Bear Power (BBP) at 0.10 highlights slight intraday buyer dominance. There is a notable divergence between the momentum characteristics (bullish MACD, ADX) and neutral-to-oversold signal from oscillators.
Sideways outlook likely as limited upside drivers persist
Over the next 5 days, the typical volatility band for NCNA is projected between $2.00 and $2.25, with the most probable scenario being sideways trading within this zone. The likelihood of a sustained price increase is low (less than 20%), as only one out of four weekly trend indicators points to further upside. Should the price break above the $2.25 resistance, a move higher is possible, whereas a fall below $2.00 would likely trigger renewed selling pressure.
Earlier, analysts noted that while NuCana was exhibiting short-term bullish momentum, its overall outlook remained clouded by mixed technical signals and longer-term resistance. The latest analysis affirms persistent sideways bias, with heightened attention on how renewed buyer activity may test the upper edge of the projected $2.00–$2.25 trading band in the days ahead.


Latest NuCana News


-
 Afghanistan
-
 Albania
-
 Algeria
-
 Angola
-
 Argentina
-
 Armenia
-
 Australia
-
 Austria
-
 Azerbaijan
-
 Bahamas
-
 Bahrain
-
 Bangladesh
-
 Belarus
-
 Belgium
-
 Bolivia
-
 Botswana
-
 Brazil
-
 Brunei
-
 Bulgaria
-
 Cambodia
-
 Cameroon
-
 Canada
-
 Chile
Chile
-
 China
China
-
 Colombia
-
 Congo
Congo
-
 Costa Rica
-
 Cote d'Ivoire
-
 Croatia
-
 Cuba
Cuba
-
 Cyprus
-
 Czechia
-
 DR Congo
-
 Denmark
-
 Dominican Republic
-
 Ecuador
-
 Egypt
Egypt
-
 El Salvador
-
 Estonia
-
 Eswatini
-
 Ethiopia
-
 Finland
-
 France
-
 Georgia
-
 Germany
-
 Ghana
Ghana
-
 Greece
-
 Haiti
Haiti
-
 Hong Kong
-
 Hungary
-
 India
India
-
 Indonesia
-
 Iran, Islamic republic
-
 Iraq
Iraq
-
 Ireland
-
 Israel
-
 Italy
Italy
-
 Jamaica
-
 Japan
Japan
-
 Jordan
-
 Kazakhstan
-
 Kenya
Kenya
-
 Korea
Korea
-
 Kuwait
-
 Kyrgyzstan
-
 Laos
Laos
-
 Latvia
-
 Lebanon
-
 Lesotho
-
 Libya
Libya
-
 Lithuania
-
 Luxembourg
-
 Madagascar
-
 Malaysia
-
 Malta
Malta
-
 Mauritius
-
 Mexico
-
 Moldova
-
 Mongolia
-
 Montenegro
-
 Morocco
-
 Mozambique
-
 Myanmar
-
 Namibia
-
 Nepal
Nepal
-
 Netherlands
-
 New Zealand
-
 Nigeria
-
 North Macedonia
-
 Norway
-
 Oman
Oman
-
 Pakistan
-
 Palestine
-
 Panama
-
 Papua New Guinea
-
 Paraguay
-
 Peru
Peru
-
 Philippines
-
 Poland
-
 Portugal
-
 Puerto Rico
-
 Qatar
Qatar
-
 Reunion
-
 Romania
-
 Rwanda
-
 Saudi Arabia
-
 Serbia
-
 Singapore
-
 Slovakia
-
 Slovenia
-
 Somalia
-
 South Africa
-
 Spain
Spain
-
 Sri Lanka
-
 Sweden
-
 Switzerland
-
 Syria
Syria
-
 Taiwan
-
 Tajikistan
-
 Tanzania
-
 Thailand
-
 Trinidad and Tobago
-
 Tunisia
-
 Turkey
-
 UAE
UAE
-
 Uganda
-
 Ukraine
-
 United Kingdom
-
United States
-
 Uruguay
-
 Uzbekistan
-
 Venezuela
-
 Vietnam
-
 Yemen
Yemen
-
 Zambia
-
 Zimbabwe
- Forex
- Crypto
