
Nvidia stock price forecast: $196.00 support as NVDA trades flat

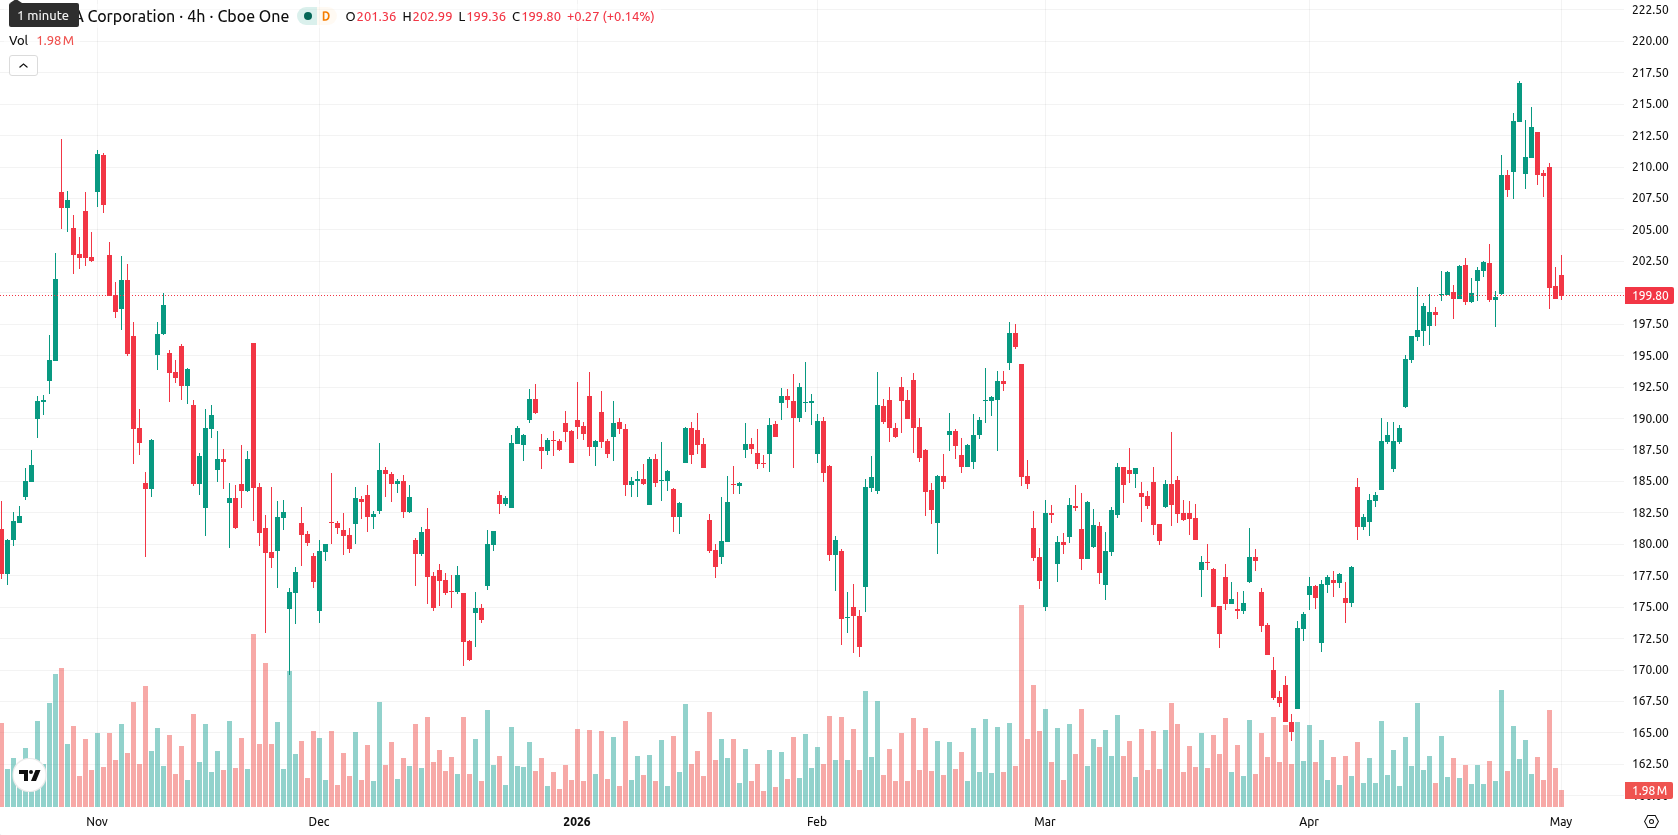
NVIDIA Corporation (NVDA) is trading at $200.47, up 0.36% on the day. The price remains positioned above its key moving averages, reflecting a positive bias across multiple timeframes.
Highlights
- Nvidia's B300 AI servers are selling near $1 million in China due to US export restrictions and tight supply, supporting elevated pricing.
- Custom and in-house AI chip initiatives by major technology firms are creating moderate headwinds for Nvidia's future demand outlook.
- Nvidia shares remain in a bullish technical setup above key supports, with consolidation likely in the $196.00–$205.00 range and upside bias prevailing.
China pricing surges as supply tightens, sentiment shifts on big tech earnings
Nvidia's B300 AI servers are commanding prices of approximately $1 million in China, driven by the intersection of tightened US export controls and acute supply constraints, which directly limit availability and support premium product pricing in a critical overseas market. In parallel, the release of major technology firms' earnings, including those from Google and Amazon, has brought increased attention to competitive pressures from custom and in-house AI chip developments, moderately influencing demand expectations for Nvidia's core products. Looking ahead, Nvidia has also scheduled its conference call to discuss first-quarter fiscal 2027 results for May 20, 2026, which could set the stage for further market-moving disclosures.
Mixed momentum and technical divergence signal potential range-bound session
Technically, NVDA is trading above the SMA-20 ($196.16), SMA-50 ($186.94), and SMA-200 ($183.72), while the Ichimoku Kijun line at $190.55 acts as immediate support. Momentum indicators show a mixed outlook: MACD (D1) remains in positive territory, with a neutral and weak ADX reading of 17.97 signaling the absence of a strong prevailing trend. The RSI stands at 54.32, reflecting moderate bullishness, while Stoch RSI indicates oversold conditions and the CCI remains neutral. BBP signals buyer dominance with an overbought reading, and the Awesome Oscillator continues to support upward momentum. The session opened with a gap up but has since reverted towards the day’s mid-range ($198.76–$208.55), and the divergence between overbought and oversold signals points to near-term uncertainty and the potential for range-bound trading.
Stable to higher moves seen unless range support or resistance breaks
Over the next five days, NVDA is expected to trade within a $196.00 to $205.00 volatility band relative to current levels, consistent with typical blue-chip weekly movements. Price action is expected to remain stable or move higher, with a probability above 80% of holding steady or advancing. A decisive break above $205.00 would shift the scenario toward incremental gains, while a drop below $196.00 would likely trigger a move down toward the Ichimoku support region.
Earlier, analysts noted that despite mounting geopolitical and regulatory risks, Nvidia maintained a neutral-to-bullish technical outlook amid persistent external uncertainties. With recent earnings releases from major tech firms intensifying competitive pressures and NVDA’s upcoming results poised to influence sentiment, traders should closely monitor the $196.00 support and $205.00 resistance levels for early signs of a trend reversal or breakout.


Latest NVDA News


-
 Afghanistan
-
 Albania
-
 Algeria
-
 Angola
-
 Argentina
-
 Armenia
-
 Australia
-
 Austria
-
 Azerbaijan
-
 Bahamas
-
 Bahrain
-
 Bangladesh
-
 Belarus
-
 Belgium
-
 Bolivia
-
 Botswana
-
 Brazil
-
 Brunei
-
 Bulgaria
-
 Cambodia
-
 Cameroon
-
 Canada
-
 Chile
Chile
-
 China
China
-
 Colombia
-
 Congo
Congo
-
 Costa Rica
-
 Cote d'Ivoire
-
 Croatia
-
 Cuba
Cuba
-
 Cyprus
-
 Czechia
-
 DR Congo
-
 Denmark
-
 Dominican Republic
-
 Ecuador
-
 Egypt
Egypt
-
 El Salvador
-
 Estonia
-
 Eswatini
-
 Ethiopia
-
 Finland
-
 France
-
 Georgia
-
 Germany
-
 Ghana
Ghana
-
 Greece
-
 Haiti
Haiti
-
 Hong Kong
-
 Hungary
-
 India
India
-
 Indonesia
-
 Iran, Islamic republic
-
 Iraq
Iraq
-
 Ireland
-
 Israel
-
 Italy
Italy
-
 Jamaica
-
 Japan
Japan
-
 Jordan
-
 Kazakhstan
-
 Kenya
Kenya
-
 Korea
Korea
-
 Kuwait
-
 Kyrgyzstan
-
 Laos
Laos
-
 Latvia
-
 Lebanon
-
 Lesotho
-
 Libya
Libya
-
 Lithuania
-
 Luxembourg
-
 Madagascar
-
 Malaysia
-
 Malta
Malta
-
 Mauritius
-
 Mexico
-
 Moldova
-
 Mongolia
-
 Montenegro
-
 Morocco
-
 Mozambique
-
 Myanmar
-
 Namibia
-
 Nepal
Nepal
-
 Netherlands
-
 New Zealand
-
 Nigeria
-
 North Macedonia
-
 Norway
-
 Oman
Oman
-
 Pakistan
-
 Palestine
-
 Panama
-
 Papua New Guinea
-
 Paraguay
-
 Peru
Peru
-
 Philippines
-
 Poland
-
 Portugal
-
 Puerto Rico
-
 Qatar
Qatar
-
 Reunion
-
 Romania
-
 Rwanda
-
 Saudi Arabia
-
 Serbia
-
 Singapore
-
 Slovakia
-
 Slovenia
-
 Somalia
-
 South Africa
-
 Spain
Spain
-
 Sri Lanka
-
 Sweden
-
 Switzerland
-
 Syria
Syria
-
 Taiwan
-
 Tajikistan
-
 Tanzania
-
 Thailand
-
 Trinidad and Tobago
-
 Tunisia
-
 Turkey
-
 UAE
UAE
-
 Uganda
-
 Ukraine
-
 United Kingdom
-
United States
-
 Uruguay
-
 Uzbekistan
-
 Venezuela
-
 Vietnam
-
 Yemen
Yemen
-
 Zambia
-
 Zimbabwe
- Forex
- Crypto
