
Meta stock consolidates as Q1 FY2026 revenue rises 33 percent year-over-year

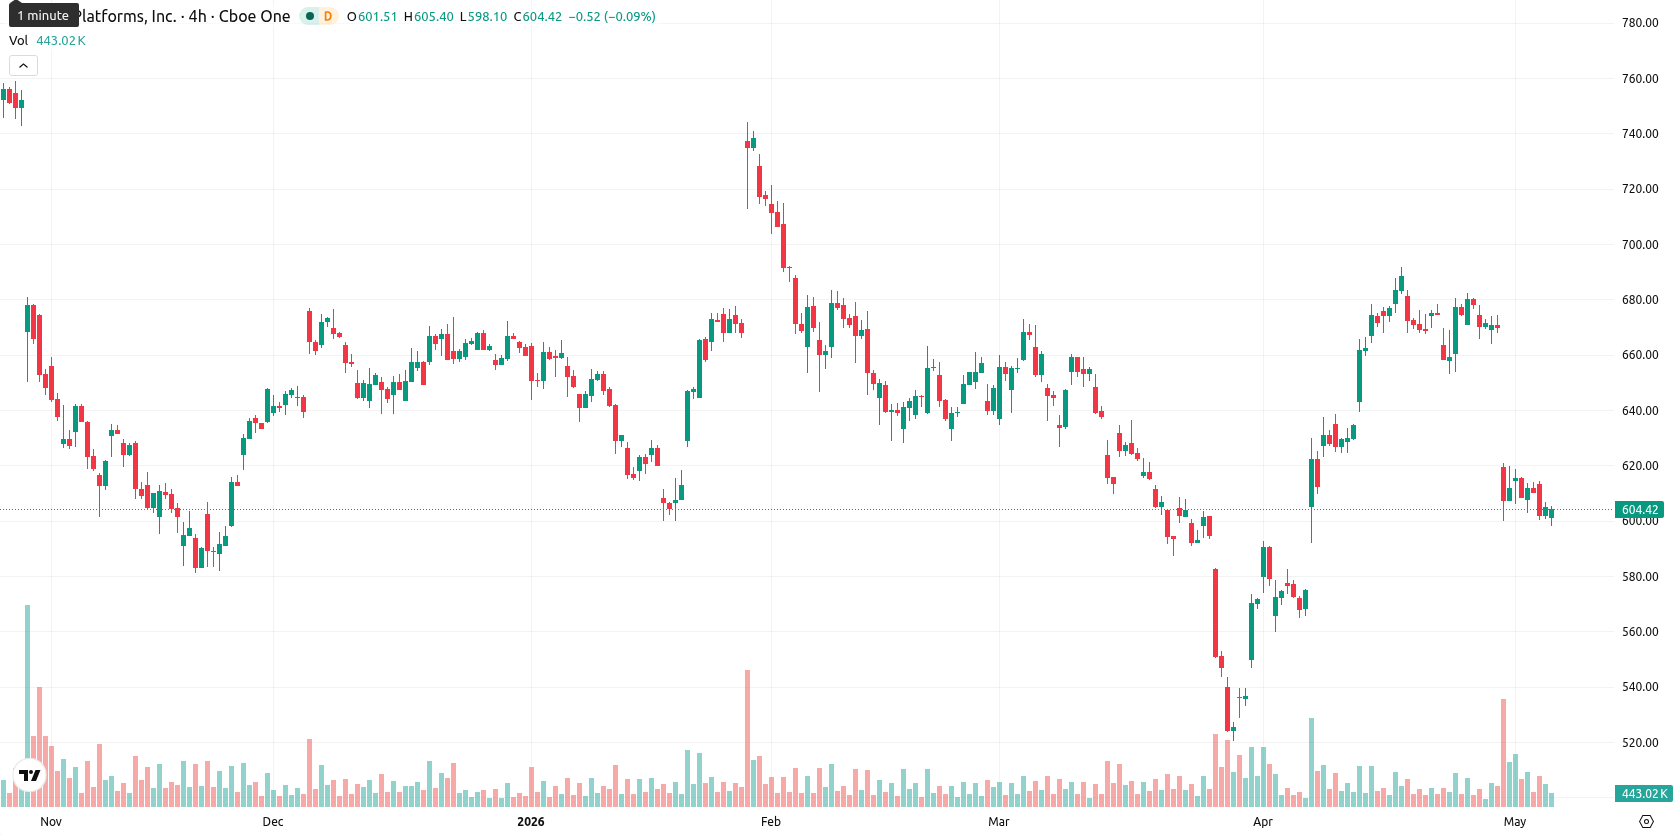
Meta Platforms, Inc. (META, formerly Facebook, Inc.) is trading at $603.84, showing a daily move of +0.04%. The stock sits below its main moving averages, signaling continued short-term and longer-term seller pressure.
Highlights
- Meta lifted its 2026 capital expenditure outlook to $135 billion, signaling an aggressive investment in AI infrastructure.
- Q1 FY2026 results beat revenue and EPS expectations, but regulatory risks in Europe add uncertainty to the forward outlook.
- Shares face multi-timeframe selling pressure and are likely to trade between $590.00 and $620.00, with downside risk dominating.
AI infrastructure drive heightens spending scrutiny amid regulatory threats
Meta has raised its capital expenditure guidance for 2026 to $135 billion in a clear move to accelerate AI infrastructure, intensifying investor focus on spending and cost structure. The company's Q1 FY2026 results showed resilient demand, with revenue up 33% year-over-year to $56 billion and adjusted EPS exceeding expectations, which helps temper concerns related to higher investment outlays. Meta also formalized a $13 billion data center expansion partnership with Morgan Stanley and JPMorgan Chase, underscoring the scale of its infrastructure bet, while fresh regulatory scrutiny in Europe over platform practices creates additional headline risk for future operations.
Oversold signals clash with bearish trend at major resistance
On the technical side, META is trading below its SMA-20 ($650.36), SMA-50 ($628.73), and SMA-200 ($677.33), placing the stock under persistent pressure across major trend benchmarks. The Ichimoku Kijun is set at $610.00, serving as an immediate resistance level above the current price. Oscillators are showing mixed momentum: the MACD is neutral on the daily chart but signals a strong sell on longer timeframes, while ADX indicates weak trend strength. Meanwhile, RSI stands at 39.49, Stochastic RSI is in oversold territory, and CCI at −116.27 further highlights oversold conditions, although BBP at −27.87 points to dominant selling pressure on intraday frames. This divergence between oversold readings and bearish momentum suggests that any upward retracement may face resistance unless buying volume increases meaningfully.
Sideways price action likely barring breakout above resistance
Over the next five trading days, the typical volatility band is expected between $590.00 and $620.00. The base case sees META moving sideways within this range amid ongoing pressure, with less than a 20% chance of an upward move. A bullish scenario emerges only if the price closes above $610.00, potentially clearing a path for a test of $620.00. Should the price drop below $600.00, the next target support stands at $590.00.
Earlier, analysts noted that Meta remained under sustained selling pressure as investor concerns around increased AI capital spending and regulatory risks weighed on the stock’s outlook. The current analysis reinforces this bearish stance, highlighting that persistent downside momentum and oversold technicals keep $610 as a key resistance level and $590 as critical support for traders to monitor in the near term.


-
 Afghanistan
-
 Albania
-
 Algeria
-
 Angola
-
 Argentina
-
 Armenia
-
 Australia
-
 Austria
-
 Azerbaijan
-
 Bahamas
-
 Bahrain
-
 Bangladesh
-
 Belarus
-
 Belgium
-
 Bolivia
-
 Botswana
-
 Brazil
-
 Brunei
-
 Bulgaria
-
 Cambodia
-
 Cameroon
-
 Canada
-
 Chile
Chile
-
 China
China
-
 Colombia
-
 Congo
Congo
-
 Costa Rica
-
 Cote d'Ivoire
-
 Croatia
-
 Cuba
Cuba
-
 Cyprus
-
 Czechia
-
 DR Congo
-
 Denmark
-
 Dominican Republic
-
 Ecuador
-
 Egypt
Egypt
-
 El Salvador
-
 Estonia
-
 Eswatini
-
 Ethiopia
-
 Finland
-
 France
-
 Georgia
-
 Germany
-
 Ghana
Ghana
-
 Greece
-
 Haiti
Haiti
-
 Hong Kong
-
 Hungary
-
 India
India
-
 Indonesia
-
 Iran, Islamic republic
-
 Iraq
Iraq
-
 Ireland
-
 Israel
-
 Italy
Italy
-
 Jamaica
-
 Japan
Japan
-
 Jordan
-
 Kazakhstan
-
 Kenya
Kenya
-
 Korea
Korea
-
 Kuwait
-
 Kyrgyzstan
-
 Laos
Laos
-
 Latvia
-
 Lebanon
-
 Lesotho
-
 Libya
Libya
-
 Lithuania
-
 Luxembourg
-
 Madagascar
-
 Malaysia
-
 Malta
Malta
-
 Mauritius
-
 Mexico
-
 Moldova
-
 Mongolia
-
 Montenegro
-
 Morocco
-
 Mozambique
-
 Myanmar
-
 Namibia
-
 Nepal
Nepal
-
 Netherlands
-
 New Zealand
-
 Nigeria
-
 North Macedonia
-
 Norway
-
 Oman
Oman
-
 Pakistan
-
 Palestine
-
 Panama
-
 Papua New Guinea
-
 Paraguay
-
 Peru
Peru
-
 Philippines
-
 Poland
-
 Portugal
-
 Puerto Rico
-
 Qatar
Qatar
-
 Reunion
-
 Romania
-
 Rwanda
-
 Saudi Arabia
-
 Serbia
-
 Singapore
-
 Slovakia
-
 Slovenia
-
 Somalia
-
 South Africa
-
 Spain
Spain
-
 Sri Lanka
-
 Sweden
-
 Switzerland
-
 Syria
Syria
-
 Taiwan
-
 Tajikistan
-
 Tanzania
-
 Thailand
-
 Trinidad and Tobago
-
 Tunisia
-
 Turkey
-
 UAE
UAE
-
 Uganda
-
 Ukraine
-
 United Kingdom
-
United States
-
 Uruguay
-
 Uzbekistan
-
 Venezuela
-
 Vietnam
-
 Yemen
Yemen
-
 Zambia
-
 Zimbabwe
- Forex
- Crypto
