
Tesla stock price forecast: $425.00 resistance in focus as TSLA gains 3.71%

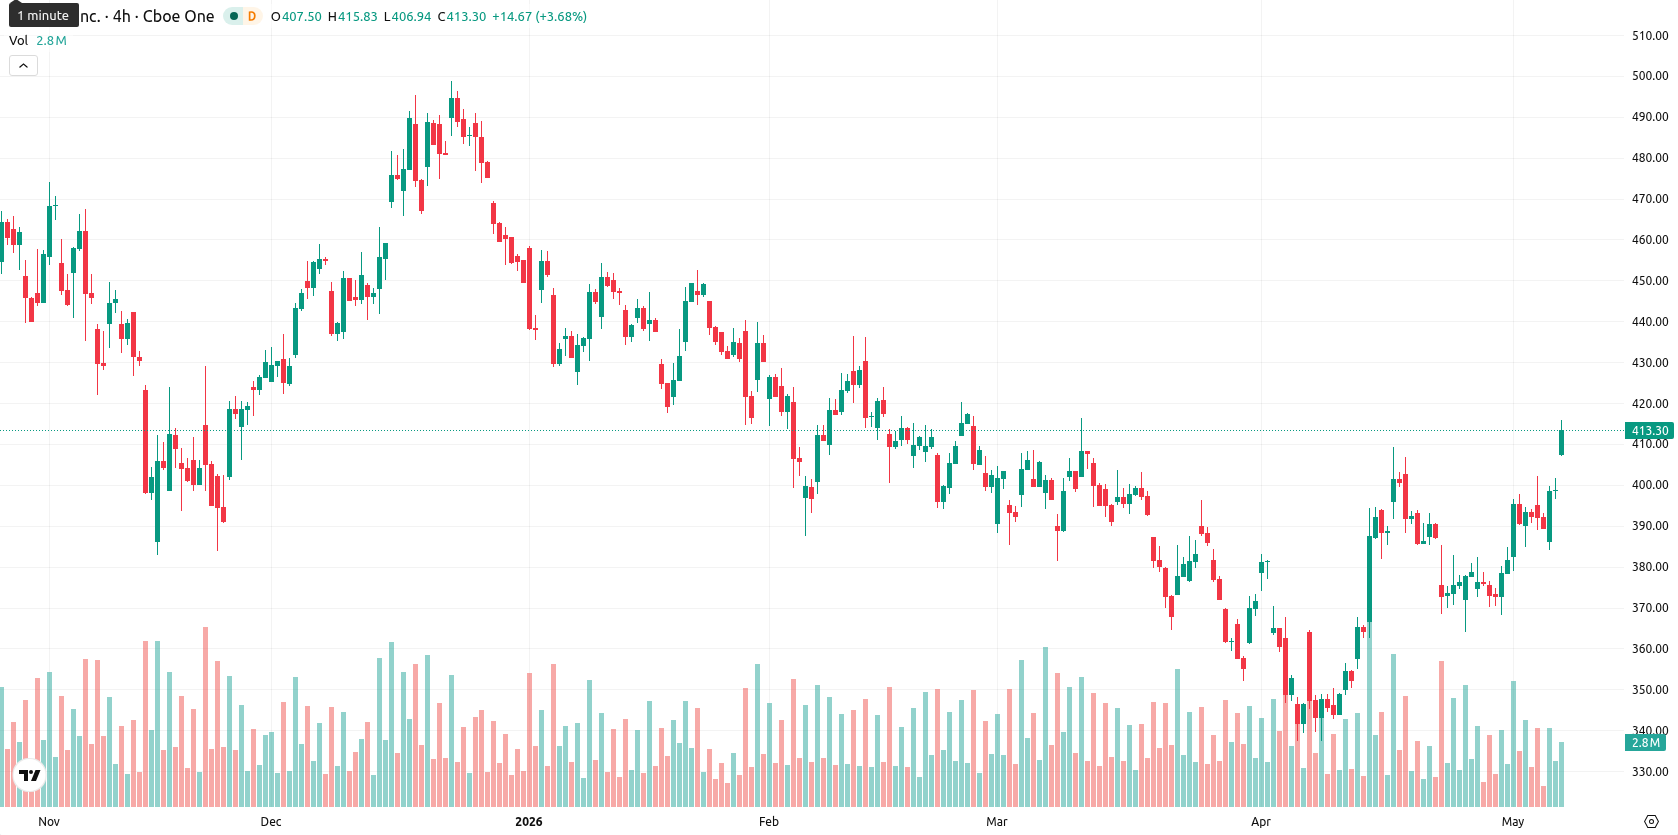
Tesla, Inc. (TSLA) is trading at $411.90, marking a daily gain of 3.71%. The stock remains well above its key moving averages, illustrating strong upward momentum for the session.
Highlights
- Tesla is recalling 218,868 U.S. vehicles to address delayed rearview camera images, signaling active regulatory compliance efforts.
- Director Kathleen Wilson-Thompson has sold $9.98 million in Tesla shares after exercising options, following strong stock performance.
- TSLA trades in a bullish structure above key trend levels, with overbought signals and a projected short-term range of $395.00–$425.00.
Regulatory actions and insider sales as sentiment and compliance drivers
Tesla has initiated a recall of 218,868 vehicles in the United States following a regulatory finding of delayed rearview camera images, highlighting the company's engagement with safety compliance and its willingness to address regulatory demands. In parallel, board director Kathleen Wilson-Thompson recently sold $9.98 million in shares following exercised options, a move often seen after notable share performance. Tesla is also progressing with updates to its home charging Wall Connectors, aiming to introduce smart features that enhance cost savings for electric vehicle owners.
Bullish signals tempered by widespread overbought conditions and volatility
The $411.90 price stands distinctly above the SMA-20 ($379.39), SMA-50 ($382.88), and SMA-200 ($403.49), reflecting strong short-, medium-, and long-term momentum. The Ichimoku Kijun level at $373.16 establishes immediate technical support. On the daily timeframe, both MACD and RSI generate Buy signals, with ADX suggesting a neutral trend. However, Stoch RSI, CCI, and Bull/Bear Power (BBP) flag overbought conditions, indicating the market may be overstretched. The Awesome Oscillator supports the prevailing bullish bias. Intraday action has shown a gap up near today’s high ($414.22), with price near the upper end of the session range ($408.70–$414.22) and moderate volatility present. This combination of positive momentum and overbought oscillators creates a divergence that could cap further near-term gains.
Directional bias favors gains as volatility sets risk boundaries
Over the next five trading days, TSLA is likely to fluctuate within a typical volatility band relative to current levels, between $395.00 and $425.00. Upside scenarios are favored, supported by consistent weekly Buy signals aside from the MACD indicator. If buying interest accelerates and price clears $425.00, a move higher could unfold. Conversely, a breakdown below $395.00 would raise the risk of a sharper pullback toward deeper support areas.
Earlier, analysts noted that Tesla's upside was limited by regulatory uncertainties and technical signals suggesting a period of consolidation. The recent breakout above prior resistance levels, combined with continued regulatory engagement and fresh product updates, strengthens the case for monitoring $425 as the next critical threshold for directional momentum in the near term.


-
 Afghanistan
-
 Albania
-
 Algeria
-
 Angola
-
 Argentina
-
 Armenia
-
 Australia
-
 Austria
-
 Azerbaijan
-
 Bahamas
-
 Bahrain
-
 Bangladesh
-
 Belarus
-
 Belgium
-
 Bolivia
-
 Botswana
-
 Brazil
-
 Brunei
-
 Bulgaria
-
 Cambodia
-
 Cameroon
-
 Canada
-
 Chile
Chile
-
 China
China
-
 Colombia
-
 Congo
Congo
-
 Costa Rica
-
 Cote d'Ivoire
-
 Croatia
-
 Cuba
Cuba
-
 Cyprus
-
 Czechia
-
 DR Congo
-
 Denmark
-
 Dominican Republic
-
 Ecuador
-
 Egypt
Egypt
-
 El Salvador
-
 Estonia
-
 Eswatini
-
 Ethiopia
-
 Finland
-
 France
-
 Georgia
-
 Germany
-
 Ghana
Ghana
-
 Greece
-
 Haiti
Haiti
-
 Hong Kong
-
 Hungary
-
 India
India
-
 Indonesia
-
 Iran, Islamic republic
-
 Iraq
Iraq
-
 Ireland
-
 Israel
-
 Italy
Italy
-
 Jamaica
-
 Japan
Japan
-
 Jordan
-
 Kazakhstan
-
 Kenya
Kenya
-
 Korea
Korea
-
 Kuwait
-
 Kyrgyzstan
-
 Laos
Laos
-
 Latvia
-
 Lebanon
-
 Lesotho
-
 Libya
Libya
-
 Lithuania
-
 Luxembourg
-
 Madagascar
-
 Malaysia
-
 Malta
Malta
-
 Mauritius
-
 Mexico
-
 Moldova
-
 Mongolia
-
 Montenegro
-
 Morocco
-
 Mozambique
-
 Myanmar
-
 Namibia
-
 Nepal
Nepal
-
 Netherlands
-
 New Zealand
-
 Nigeria
-
 North Macedonia
-
 Norway
-
 Oman
Oman
-
 Pakistan
-
 Palestine
-
 Panama
-
 Papua New Guinea
-
 Paraguay
-
 Peru
Peru
-
 Philippines
-
 Poland
-
 Portugal
-
 Puerto Rico
-
 Qatar
Qatar
-
 Reunion
-
 Romania
-
 Rwanda
-
 Saudi Arabia
-
 Serbia
-
 Singapore
-
 Slovakia
-
 Slovenia
-
 Somalia
-
 South Africa
-
 Spain
Spain
-
 Sri Lanka
-
 Sweden
-
 Switzerland
-
 Syria
Syria
-
 Taiwan
-
 Tajikistan
-
 Tanzania
-
 Thailand
-
 Trinidad and Tobago
-
 Tunisia
-
 Turkey
-
 UAE
UAE
-
 Uganda
-
 Ukraine
-
 United Kingdom
-
United States
-
 Uruguay
-
 Uzbekistan
-
 Venezuela
-
 Vietnam
-
 Yemen
Yemen
-
 Zambia
-
 Zimbabwe
- Forex
- Crypto
