
Steady price for Meta stock as net income rises 61% on AI ad gains

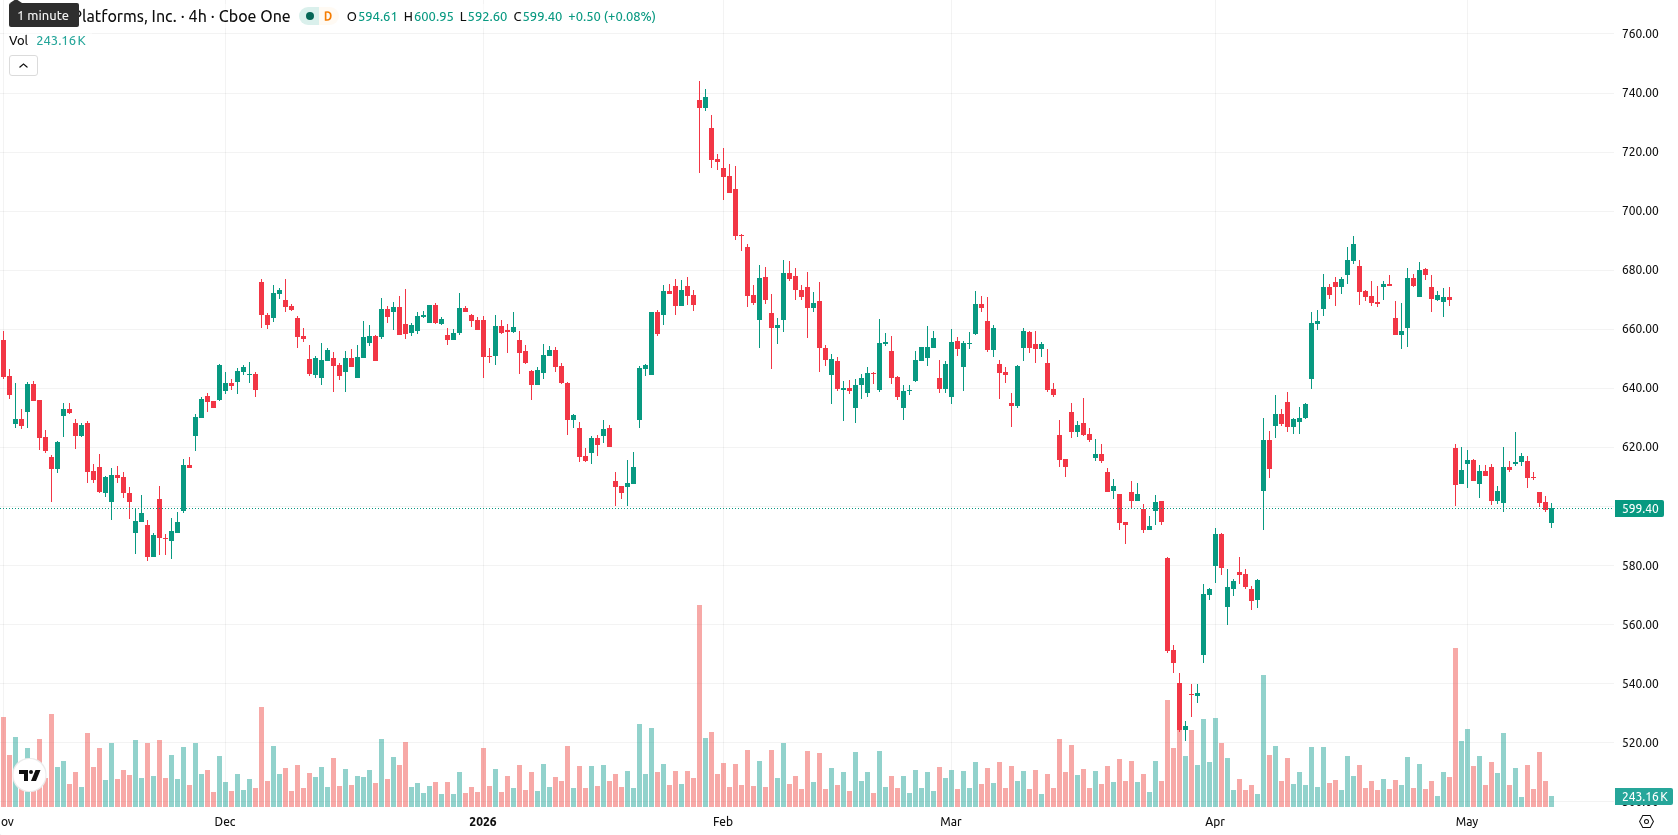
Meta Platforms, Inc. (META, formerly Facebook, Inc.) is trading at $598.92 after a marginal daily decline of 0.06%. The stock is currently positioned below its key short-, medium-, and long-term moving averages, reflecting continued downward price momentum.
Highlights
- Meta's Q1 2026 revenue surged 33% to $56.31 billion, driven by strong AI-powered advertising demand and monetization.
- Net income jumped 61% to $26.77 billion as the company restructured to focus on artificial intelligence amid regulatory concerns.
- Despite robust results, Meta stock faces strong selling pressure and is expected to trade between $585 and $615 amid persistent bearish technical signals.
Earnings strength offset by AI restructuring and regulatory warnings
Meta posted robust financial results for the first quarter of 2026, with revenue rising 33% year-over-year to $56.31 billion, reflecting strong demand and accelerated monetization. Net income increased by 61% to $26.77 billion, and diluted earnings per share reached $10.44, largely attributed to the effectiveness of AI-powered advertising initiatives. The company also announced a major restructuring aimed at prioritizing artificial intelligence, including 8,000 job reductions, and issued a warning that legal and regulatory risks could impact future outcomes, though price action has remained under broader selling pressure.
Bearish bias confirmed as technicals show resistance and oversold signals
SMA-20 is at $647.09, SMA-50 at $625.57, and SMA-200 at $675.30, all standing above the current price. The Ichimoku Kijun level on the daily chart is at $628.11, marking a nearby resistance zone. Oscillator data confirm prevailing weakness: RSI measures 39.21, CCI is at -103.40, Stoch RSI reads 0.00, and BBP is -19.32, all consistent with intraday oversold conditions. The MACD and ADX support bearish momentum, while the Awesome Oscillator continues to reinforce downward bias. Price is holding near the session’s low range between $598.10 and $604.58, and overall intraday volatility remains subdued.
Limited rebound prospects as tight range and low volatility persist
In the very near term, META is expected to remain rangebound considering current volatility and prevailing signals, with a probable weekly band of $585 to $615. There is a low likelihood (less than 20%) of a significant sustained rebound at present. Price action would need a break and hold above resistance at $628 to signal a shift toward a bullish scenario, whereas a failure of $585 support could bring a deeper downside extension.
In a recent review, analysts noted that Meta shares were exhibiting persistent technical weakness despite strong fundamental results, with sentiment remaining broadly bearish. The current analysis reinforces this outlook as downside momentum prevails, making a sustained move above the $628 resistance level the key signal to monitor for any potential shift toward recovery.


-
 Afghanistan
-
 Albania
-
 Algeria
-
 Angola
-
 Argentina
-
 Armenia
-
 Australia
-
 Austria
-
 Azerbaijan
-
 Bahamas
-
 Bahrain
-
 Bangladesh
-
 Belarus
-
 Belgium
-
 Bolivia
-
 Botswana
-
 Brazil
-
 Brunei
-
 Bulgaria
-
 Cambodia
-
 Cameroon
-
 Canada
-
 Chile
Chile
-
 China
China
-
 Colombia
-
 Congo
Congo
-
 Costa Rica
-
 Cote d'Ivoire
-
 Croatia
-
 Cuba
Cuba
-
 Cyprus
-
 Czechia
-
 DR Congo
-
 Denmark
-
 Dominican Republic
-
 Ecuador
-
 Egypt
Egypt
-
 El Salvador
-
 Estonia
-
 Eswatini
-
 Ethiopia
-
 Finland
-
 France
-
 Georgia
-
 Germany
-
 Ghana
Ghana
-
 Greece
-
 Haiti
Haiti
-
 Hong Kong
-
 Hungary
-
 India
India
-
 Indonesia
-
 Iran, Islamic republic
-
 Iraq
Iraq
-
 Ireland
-
 Israel
-
 Italy
Italy
-
 Jamaica
-
 Japan
Japan
-
 Jordan
-
 Kazakhstan
-
 Kenya
Kenya
-
 Korea
Korea
-
 Kuwait
-
 Kyrgyzstan
-
 Laos
Laos
-
 Latvia
-
 Lebanon
-
 Lesotho
-
 Libya
Libya
-
 Lithuania
-
 Luxembourg
-
 Madagascar
-
 Malaysia
-
 Malta
Malta
-
 Mauritius
-
 Mexico
-
 Moldova
-
 Mongolia
-
 Montenegro
-
 Morocco
-
 Mozambique
-
 Myanmar
-
 Namibia
-
 Nepal
Nepal
-
 Netherlands
-
 New Zealand
-
 Nigeria
-
 North Macedonia
-
 Norway
-
 Oman
Oman
-
 Pakistan
-
 Palestine
-
 Panama
-
 Papua New Guinea
-
 Paraguay
-
 Peru
Peru
-
 Philippines
-
 Poland
-
 Portugal
-
 Puerto Rico
-
 Qatar
Qatar
-
 Reunion
-
 Romania
-
 Rwanda
-
 Saudi Arabia
-
 Serbia
-
 Singapore
-
 Slovakia
-
 Slovenia
-
 Somalia
-
 South Africa
-
 Spain
Spain
-
 Sri Lanka
-
 Sweden
-
 Switzerland
-
 Syria
Syria
-
 Taiwan
-
 Tajikistan
-
 Tanzania
-
 Thailand
-
 Trinidad and Tobago
-
 Tunisia
-
 Turkey
-
 UAE
UAE
-
 Uganda
-
 Ukraine
-
 United Kingdom
-
United States
-
 Uruguay
-
 Uzbekistan
-
 Venezuela
-
 Vietnam
-
 Yemen
Yemen
-
 Zambia
-
 Zimbabwe
- Forex
- Crypto
