
Meta stock edges higher as Q1 net income rises 60.86% year-over-year

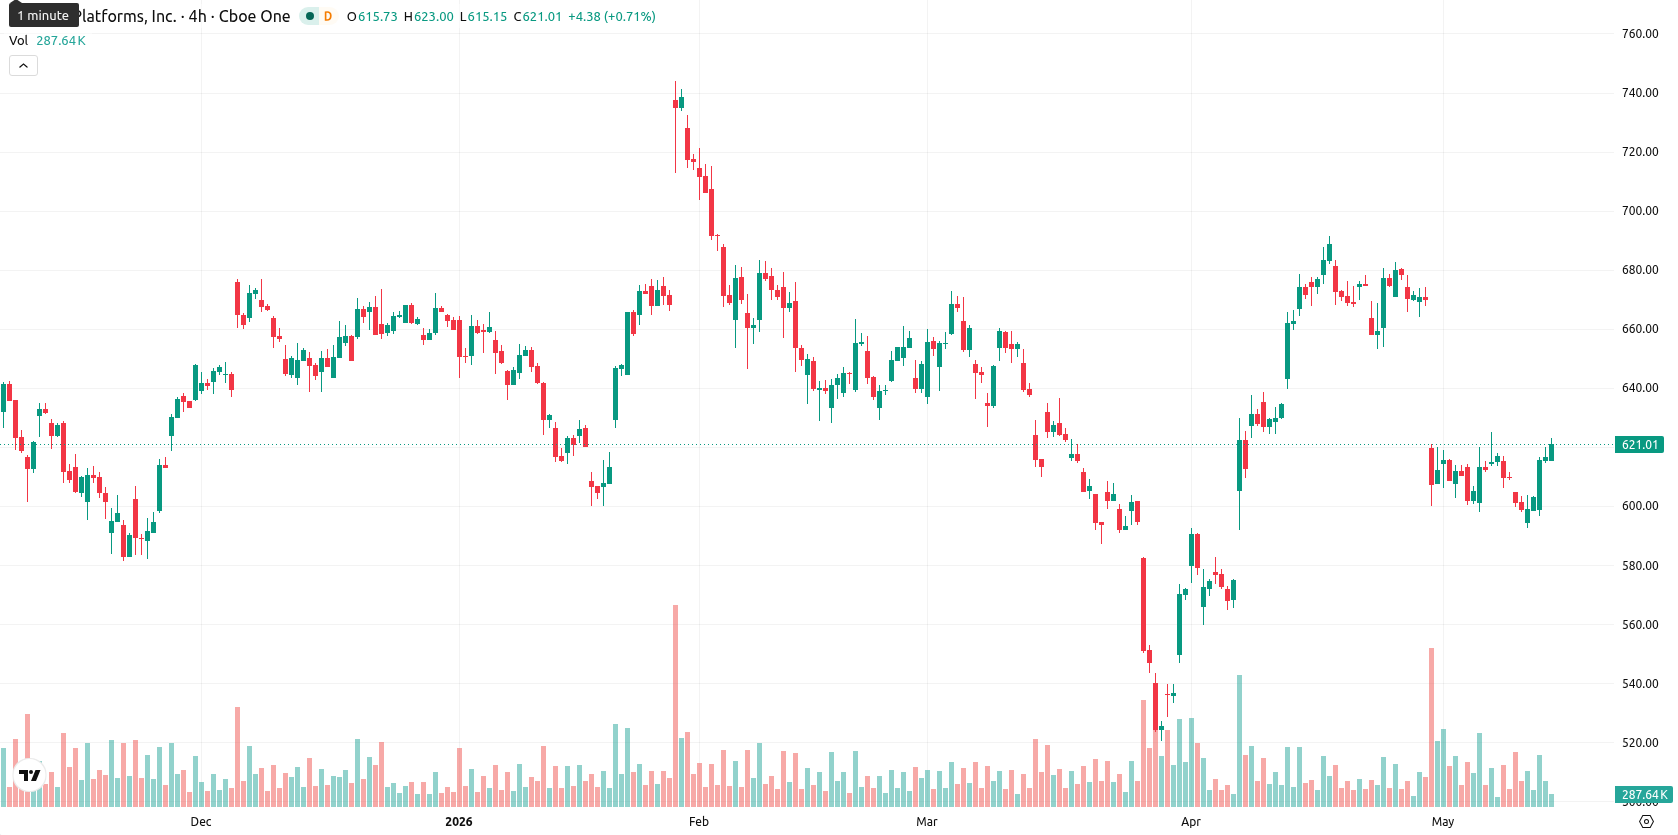
Meta Platforms, Inc. (META, formerly Facebook, Inc.) is trading at $621.61, up 1.01% for the day. The price is currently below its key moving averages, reflecting short-term weakness after modest intraday gains.
Highlights
- Meta’s Q1 2026 net income soared 60.86% year-over-year to $26.773 billion, far surpassing expectations and fueling stock demand.
- Robust revenue of $56.31 billion and a daily user base of 3.56 billion underline sustained commercial strength and investor confidence.
- META trades below key moving averages with weak momentum; price is expected to range between $605 and $635 amid bearish technical signals.
Investor demand surges as profit beats outpace capex concerns
Meta’s first quarter 2026 net income surged to $26.773 billion, marking a 60.86% year-over-year rise and underscoring exceptional operational profitability that boosts investor demand for the stock. The company also reported revenue of $56.31 billion, beating expectations and demonstrating strong commercial momentum, while maintaining a robust balance sheet with $81.2 billion in cash and marketable securities against $58.7 billion in debt. Although elevated capital expenditure guidance for 2026 and another significant loss from Reality Labs reflect continued heavy investment, Meta’s ongoing buybacks and daily user base of 3.56 billion continue to support the business’s long-term growth narrative.
Bearish momentum as price hovers under resistance with mixed signals
The $621.61 price level places META beneath the MA-20 ($641.28), just below the MA-50 ($623.75), and well under the MA-200 ($674.24). The Ichimoku Kijun sits at $641.64, establishing that zone as immediate resistance. D1 MACD and ADX both reveal a lack of strong momentum, while oscillators including RSI, CCI, and Stoch RSI remain bearish or neutral, confirming an absence of overbought or oversold extremes on the daily timeframe. BBP registers oversold and sellers continue to dominate intraday, yet the Awesome Oscillator, although negative, is not reinforcing a clear trend direction. Price action started the session with a mild gap up and is now trading close to the day’s highs, reflecting modest intraday volatility amid conflicting momentum and price signals.
Limited rebound odds as persistent weakness caps volatility outlook
Over the next five days, the expected volatility band for META is between $605 and $635. The probability of a further price increase is low (under 20%), making an additional dip more likely if signals persist. A rebound scenario would first require a break above the $641–$642 resistance, which could prompt short-covering. Failing that, a decisive move below $605 would expose the asset to another test of year-to-date lows, while baseline expectations favor sideways movement as overall momentum remains weak.
Earlier, analysts noted that Meta faced continued technical pressures and hesitant sentiment despite restructuring and investment in its artificial intelligence initiatives. The current analysis maintains this cautious view, highlighting that as momentum remains weak and sellers dominate, a break above the $641–$642 resistance would be essential to spark any sustained upside reversal.


-
 Afghanistan
-
 Albania
-
 Algeria
-
 Angola
-
 Argentina
-
 Armenia
-
 Australia
-
 Austria
-
 Azerbaijan
-
 Bahamas
-
 Bahrain
-
 Bangladesh
-
 Belarus
-
 Belgium
-
 Bolivia
-
 Botswana
-
 Brazil
-
 Brunei
-
 Bulgaria
-
 Cambodia
-
 Cameroon
-
 Canada
-
 Chile
Chile
-
 China
China
-
 Colombia
-
 Congo
Congo
-
 Costa Rica
-
 Cote d'Ivoire
-
 Croatia
-
 Cuba
Cuba
-
 Cyprus
-
 Czechia
-
 DR Congo
-
 Denmark
-
 Dominican Republic
-
 Ecuador
-
 Egypt
Egypt
-
 El Salvador
-
 Estonia
-
 Eswatini
-
 Ethiopia
-
 Finland
-
 France
-
 Georgia
-
 Germany
-
 Ghana
Ghana
-
 Greece
-
 Haiti
Haiti
-
 Hong Kong
-
 Hungary
-
 India
India
-
 Indonesia
-
 Iran, Islamic republic
-
 Iraq
Iraq
-
 Ireland
-
 Israel
-
 Italy
Italy
-
 Jamaica
-
 Japan
Japan
-
 Jordan
-
 Kazakhstan
-
 Kenya
Kenya
-
 Korea
Korea
-
 Kuwait
-
 Kyrgyzstan
-
 Laos
Laos
-
 Latvia
-
 Lebanon
-
 Lesotho
-
 Libya
Libya
-
 Lithuania
-
 Luxembourg
-
 Madagascar
-
 Malaysia
-
 Malta
Malta
-
 Mauritius
-
 Mexico
-
 Moldova
-
 Mongolia
-
 Montenegro
-
 Morocco
-
 Mozambique
-
 Myanmar
-
 Namibia
-
 Nepal
Nepal
-
 Netherlands
-
 New Zealand
-
 Nigeria
-
 North Macedonia
-
 Norway
-
 Oman
Oman
-
 Pakistan
-
 Palestine
-
 Panama
-
 Papua New Guinea
-
 Paraguay
-
 Peru
Peru
-
 Philippines
-
 Poland
-
 Portugal
-
 Puerto Rico
-
 Qatar
Qatar
-
 Reunion
-
 Romania
-
 Rwanda
-
 Saudi Arabia
-
 Serbia
-
 Singapore
-
 Slovakia
-
 Slovenia
-
 Somalia
-
 South Africa
-
 Spain
Spain
-
 Sri Lanka
-
 Sweden
-
 Switzerland
-
 Syria
Syria
-
 Taiwan
-
 Tajikistan
-
 Tanzania
-
 Thailand
-
 Trinidad and Tobago
-
 Tunisia
-
 Turkey
-
 UAE
UAE
-
 Uganda
-
 Ukraine
-
 United Kingdom
-
United States
-
 Uruguay
-
 Uzbekistan
-
 Venezuela
-
 Vietnam
-
 Yemen
Yemen
-
 Zambia
-
 Zimbabwe
- Forex
- Crypto
