
Tesla stock slides as price closes near bottom of recent range with resistance at $403: weekly outlook

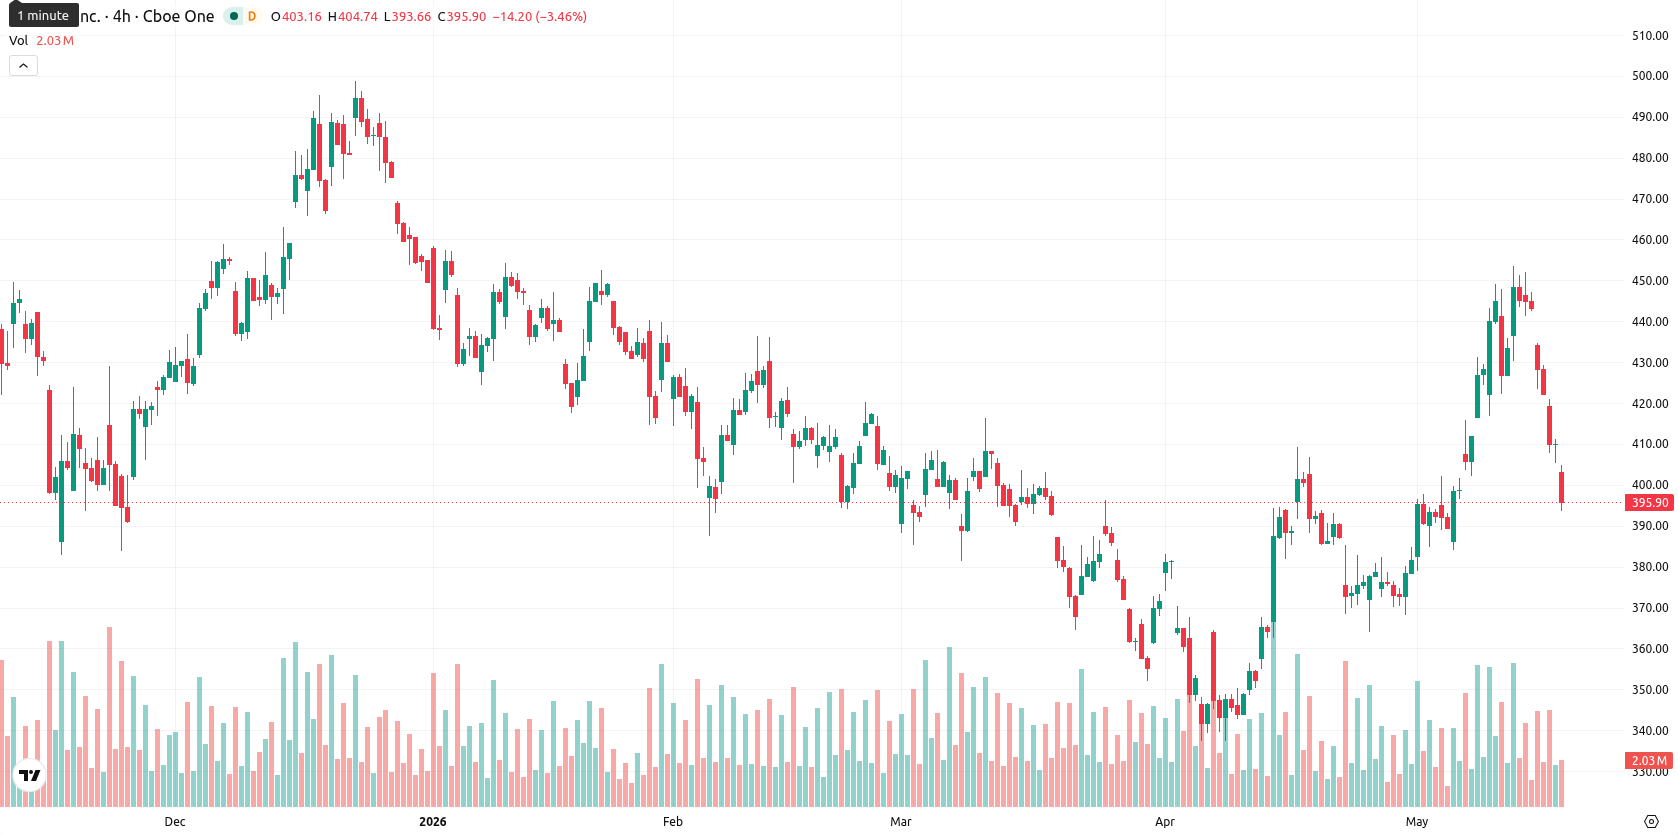
Tesla, Inc. (TSLA) is currently trading at $397.20, sitting just below the weekly MA-20 ($402.97), slightly above MA-50 ($393.78), and well above MA-200 ($278.01). Over the past week, the price declined by $24.78 (5.92%), placing TSLA at the bottom of its weekly range and highlighting caution around immediate resistance while keeping its long-term bullish outlook intact due to continued support from the MA-50.
Highlights
- TSLA faces medium-term resistance, trading just below a key moving average while maintaining a long-term bullish structure with dynamic support nearby.
- Mixed momentum and overbought signals reveal recent buyer dominance, yet downside pressure prevails as price sits at the bottom of the weekly range following a 5.92% drop.
- Next week's expected range is $406.83 to $428.92, with baseline bias toward sideways movement and only a 25% probability of a strong rebound.
Insider selling and regulatory setbacks dampen sentiment amid selective fund inflows
Tesla's Chief Financial Officer Vaibhav Taneja sold 3,000 shares for $1.35 million, drawing market scrutiny to insider transactions. The company also faced regulatory and operational headwinds, including investigations into its autonomous driving technology and a recall caused by rearview camera issues. Tesla abandoned plans to build a factory in India, while still raising U.S. Model Y prices and attracting increased investment from funds like Gabelli Funds LLC and Aegis Wealth Management Inc.
Mixed technical momentum with overbought signals amid elevated volatility this week
On the weekly chart, TSLA closed well below its MA-20 but remains supported by MA-50 and substantially above MA-200, indicating fundamental long-term strength despite recent losses. Weekly momentum and trend indicators are mixed: the MACD and ADX are both neutral, RSI is balanced at 51.97, but the Stochastic RSI gives a Strong Sell signal and the CCI is neutral. Bull/Bear Power reflects an overbought market state, though sellers have dominated recently, and volatility for the week reached 11.83%, underlining the sharp pullback. Key support resides at $393 (MA-50), while resistance levels are found near $403 (MA-20) and $429.
Sideways outlook expected as breakout hinges on renewed momentum next week
For the next five trading days, TSLA is forecast to trade between $406.83 and $428.92, with a 25% probability of an upward surge given just one of four key momentum signals suggests buying. The primary scenario expects sideways movement near current prices. If bullish momentum revives and TSLA breaks above resistance, a move toward the $429 area could develop. However, if selling presses the price below immediate support, a test of $394 may occur amid persistent volatility.
Earlier, analysts noted that Tesla faced renewed market pressure amid legal setbacks for CEO Elon Musk and sector-wide weakness in technology shares. With fresh regulatory headwinds and mixed insider activity now compounding the technical indecision, traders should monitor the $403–$429 resistance zone for signs of a directional breakout.


Latest Tesla News


-
 Afghanistan
-
 Albania
-
 Algeria
-
 Angola
-
 Argentina
-
 Armenia
-
 Australia
-
 Austria
-
 Azerbaijan
-
 Bahamas
-
 Bahrain
-
 Bangladesh
-
 Belarus
-
 Belgium
-
 Bolivia
-
 Botswana
-
 Brazil
-
 Brunei
-
 Bulgaria
-
 Cambodia
-
 Cameroon
-
 Canada
-
 Chile
Chile
-
 China
China
-
 Colombia
-
 Congo
Congo
-
 Costa Rica
-
 Cote d'Ivoire
-
 Croatia
-
 Cuba
Cuba
-
 Cyprus
-
 Czechia
-
 DR Congo
-
 Denmark
-
 Dominican Republic
-
 Ecuador
-
 Egypt
Egypt
-
 El Salvador
-
 Estonia
-
 Eswatini
-
 Ethiopia
-
 Finland
-
 France
-
 Georgia
-
 Germany
-
 Ghana
Ghana
-
 Greece
-
 Haiti
Haiti
-
 Hong Kong
-
 Hungary
-
 India
India
-
 Indonesia
-
 Iran, Islamic republic
-
 Iraq
Iraq
-
 Ireland
-
 Israel
-
 Italy
Italy
-
 Jamaica
-
 Japan
Japan
-
 Jordan
-
 Kazakhstan
-
 Kenya
Kenya
-
 Korea
Korea
-
 Kuwait
-
 Kyrgyzstan
-
 Laos
Laos
-
 Latvia
-
 Lebanon
-
 Lesotho
-
 Libya
Libya
-
 Lithuania
-
 Luxembourg
-
 Madagascar
-
 Malaysia
-
 Malta
Malta
-
 Mauritius
-
 Mexico
-
 Moldova
-
 Mongolia
-
 Montenegro
-
 Morocco
-
 Mozambique
-
 Myanmar
-
 Namibia
-
 Nepal
Nepal
-
 Netherlands
-
 New Zealand
-
 Nigeria
-
 North Macedonia
-
 Norway
-
 Oman
Oman
-
 Pakistan
-
 Palestine
-
 Panama
-
 Papua New Guinea
-
 Paraguay
-
 Peru
Peru
-
 Philippines
-
 Poland
-
 Portugal
-
 Puerto Rico
-
 Qatar
Qatar
-
 Reunion
-
 Romania
-
 Rwanda
-
 Saudi Arabia
-
 Serbia
-
 Singapore
-
 Slovakia
-
 Slovenia
-
 Somalia
-
 South Africa
-
 Spain
Spain
-
 Sri Lanka
-
 Sweden
-
 Switzerland
-
 Syria
Syria
-
 Taiwan
-
 Tajikistan
-
 Tanzania
-
 Thailand
-
 Trinidad and Tobago
-
 Tunisia
-
 Turkey
-
 UAE
UAE
-
 Uganda
-
 Ukraine
-
 United Kingdom
-
United States
-
 Uruguay
-
 Uzbekistan
-
 Venezuela
-
 Vietnam
-
 Yemen
Yemen
-
 Zambia
-
 Zimbabwe
- Forex
- Crypto
