
-1.96% for Nano Dimension stock as near-term pressure persists under $1.56

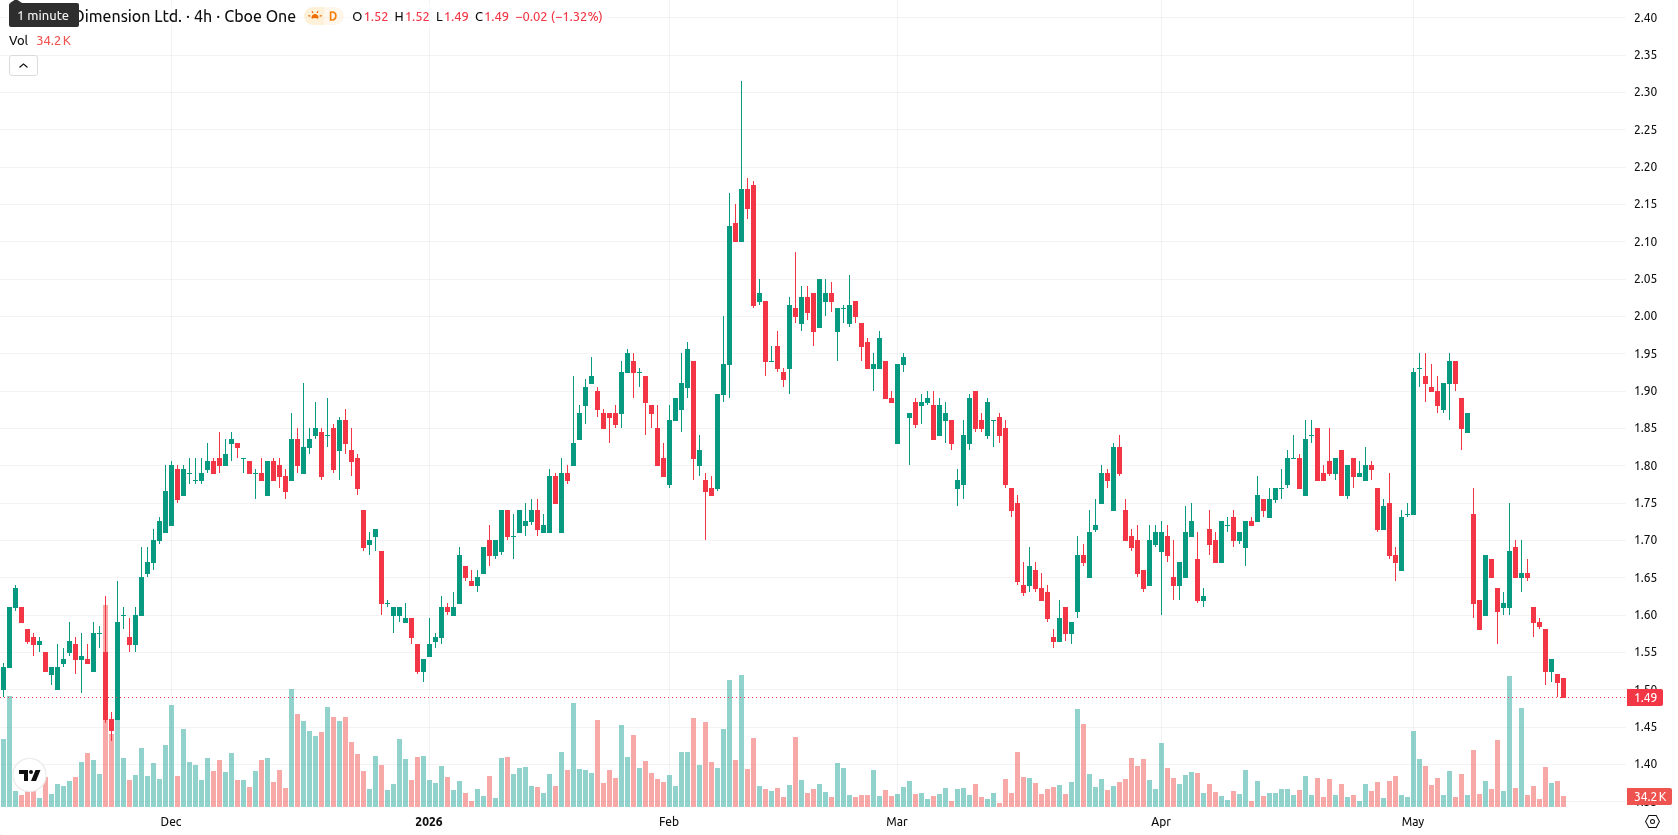
Nano Dimension Ltd (NNDM) is trading at $1.50 after declining 1.96% today, currently sitting below its key moving averages. The asset's position reflects persistent downward momentum in the near and medium term.
Highlights
- NNDM remains under sustained selling pressure, trading consistently below short-, medium-, and long-term moving averages.
- Momentum and trend indicators collectively signal a bearish environment, with oversold conditions suggesting persistent weakness despite only modest volatility.
- Expect consolidation between $1.46 and $1.56 over the next five sessions, with a less than 20% chance of a sustained upside move.
Oversold momentum persists as sellers maintain technical control
NNDM’s price remains below the SMA-20 at $1.73, the SMA-50 at $1.72, and the SMA-200 at $1.68. The Ichimoku Kijun level at $1.73 acts as immediate resistance. Technical indicators confirm sellers' control: MACD is on a Sell signal, ADX is Neutral, and the D1 RSI at 35.14, together with a deeply negative CCI and negative Stoch RSI, all indicate oversold conditions. BBP stands at -0.13, suggesting sellers continue to dominate, and the Awesome Oscillator is negative in line with the trend. Price activity has mostly tracked near session lows, with modest volatility and a prevailing bearish tone since the open.
Range-bound pattern likely as bearish signals cap upside
In the short term, NNDM is expected to consolidate within a $1.46 to $1.56 volatility band relative to current levels. All major weekly indicators (RSI, ADX, MACD, and moving averages) are showing Sell or Neutral signals, making the probability of a sustained upward move very low (less than 20%). The most likely scenario is continued range-bound trading between $1.46 and $1.56. A move above $1.56 would require improvement in momentum and clearing immediate resistance, while a drop below $1.46 could renew downward momentum and expose the stock to further losses.
Previously it was reported that Nano Dimension maintained persistent technical weakness and dominant bearish momentum. The current analysis reinforces this outlook, highlighting that sellers continue to control the trend and that a decisive move above immediate resistance would be required to signal any reversal.


Latest Nano Dimension News


-
 Afghanistan
-
 Albania
-
 Algeria
-
 Angola
-
 Argentina
-
 Armenia
-
 Australia
-
 Austria
-
 Azerbaijan
-
 Bahamas
-
 Bahrain
-
 Bangladesh
-
 Belarus
-
 Belgium
-
 Bolivia
-
 Botswana
-
 Brazil
-
 Brunei
-
 Bulgaria
-
 Cambodia
-
 Cameroon
-
 Canada
-
 Chile
Chile
-
 China
China
-
 Colombia
-
 Congo
Congo
-
 Costa Rica
-
 Cote d'Ivoire
-
 Croatia
-
 Cuba
Cuba
-
 Cyprus
-
 Czechia
-
 DR Congo
-
 Denmark
-
 Dominican Republic
-
 Ecuador
-
 Egypt
Egypt
-
 El Salvador
-
 Estonia
-
 Eswatini
-
 Ethiopia
-
 Finland
-
 France
-
 Georgia
-
 Germany
-
 Ghana
Ghana
-
 Greece
-
 Haiti
Haiti
-
 Hong Kong
-
 Hungary
-
 India
India
-
 Indonesia
-
 Iran, Islamic republic
-
 Iraq
Iraq
-
 Ireland
-
 Israel
-
 Italy
Italy
-
 Jamaica
-
 Japan
Japan
-
 Jordan
-
 Kazakhstan
-
 Kenya
Kenya
-
 Korea
Korea
-
 Kuwait
-
 Kyrgyzstan
-
 Laos
Laos
-
 Latvia
-
 Lebanon
-
 Lesotho
-
 Libya
Libya
-
 Lithuania
-
 Luxembourg
-
 Madagascar
-
 Malaysia
-
 Malta
Malta
-
 Mauritius
-
 Mexico
-
 Moldova
-
 Mongolia
-
 Montenegro
-
 Morocco
-
 Mozambique
-
 Myanmar
-
 Namibia
-
 Nepal
Nepal
-
 Netherlands
-
 New Zealand
-
 Nigeria
-
 North Macedonia
-
 Norway
-
 Oman
Oman
-
 Pakistan
-
 Palestine
-
 Panama
-
 Papua New Guinea
-
 Paraguay
-
 Peru
Peru
-
 Philippines
-
 Poland
-
 Portugal
-
 Puerto Rico
-
 Qatar
Qatar
-
 Reunion
-
 Romania
-
 Rwanda
-
 Saudi Arabia
-
 Serbia
-
 Singapore
-
 Slovakia
-
 Slovenia
-
 Somalia
-
 South Africa
-
 Spain
Spain
-
 Sri Lanka
-
 Sweden
-
 Switzerland
-
 Syria
Syria
-
 Taiwan
-
 Tajikistan
-
 Tanzania
-
 Thailand
-
 Trinidad and Tobago
-
 Tunisia
-
 Turkey
-
 UAE
UAE
-
 Uganda
-
 Ukraine
-
 United Kingdom
-
United States
-
 Uruguay
-
 Uzbekistan
-
 Venezuela
-
 Vietnam
-
 Yemen
Yemen
-
 Zambia
-
 Zimbabwe
- Forex
- Crypto
