
Institutional buying lifts Tesla stock 2.17% higher

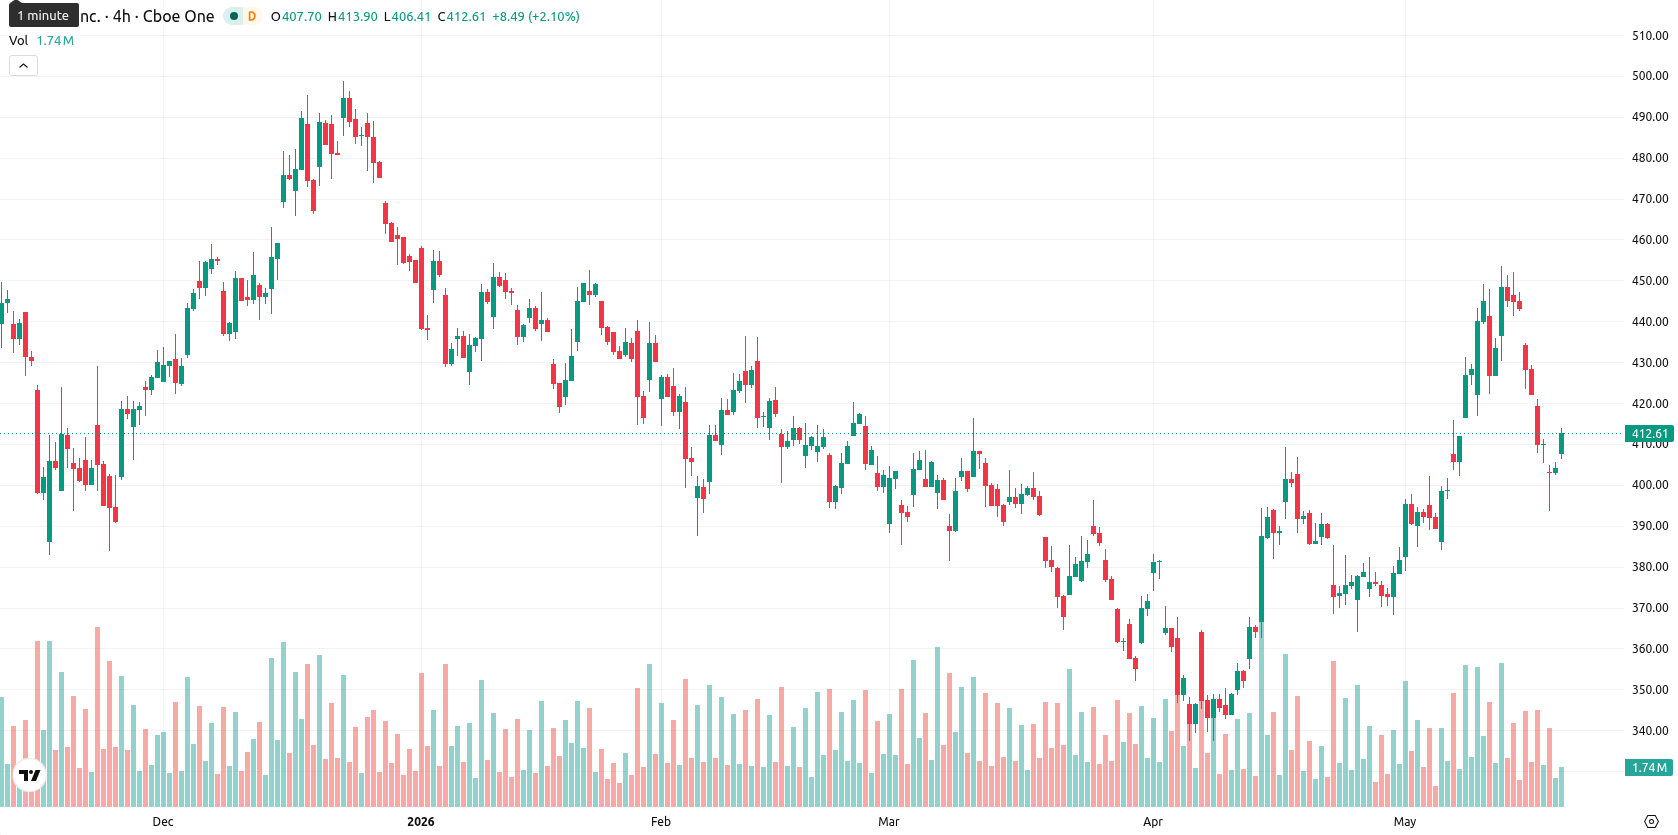
Tesla, Inc. (TSLA) is trading at $412.14, up 2.17% on the day and holding above its key moving averages, indicating near-term technical strength.
Highlights
- Tesla exceeded Q1 2026 EPS expectations with $0.41, driven by a strong automotive gross margin of 21.1%.
- Services and Full Self-Driving revenue grew 42% year-over-year to $3.75 billion, with rising institutional investment interest.
- Shares trade within a moderately bullish corridor of $401 to $423, though mixed technical signals suggest potential for sideways consolidation.
Profit beat and rising FSD demand drive institutional inflows
Tesla has reported Q1 2026 earnings per share of $0.41, surpassing consensus expectations and signaling strong underlying profitability as automotive gross margin jumped to 21.1%. Services and Full Self-Driving revenue climbed by 42% year-over-year to $3.75 billion, accompanied by meaningful growth in active FSD subscriptions and enhanced product updates focused on reliability. Large institutional investors such as HighTower Advisors and Mitsubishi UFJ Asset Management increased their stakes during the quarter, highlighting growing institutional demand.
Momentum divergence as indicators flash mixed signals near support
MA-20 is located at $403.01, MA-50 at $387.13, and MA-200 at $408.40, with the Ichimoku Kijun level at $404.09 providing immediate support. MACD signals a strong buy, while the ADX on the daily chart is neutral, reflecting limited conviction in the current trend. RSI is at 50, indicating a neutral-to-positive stance; meanwhile, both Stoch RSI and Bull/Bear Power (BBP) point to short-term oversold conditions and seller dominance on the intraday timeframe. The CCI and Awesome Oscillator are neutral, and the price action shows the session opened with a small gap up and is trading near session highs, suggesting moderate intraday volatility and session strength. However, the divergence among oscillators, with oversold signals from Stoch RSI and BBP alongside bullish MACD and upward daily price action, underscores mixed momentum and limited confirmation for the current advance.
Sideways trading expected as volatility band limits breakout odds
In the near term, TSLA is likely to oscillate within a volatility band of $401 to $423, with only moderate probability for a break outside this corridor. Sideways movement around these levels remains the baseline, reflecting stable key moving averages and a neutral long-term ADX. A decisive move above $423 could open up further upside, aligning with strong daily MACD momentum and support below the price. Should the price fall below $401, the next scenario would be a short-term pullback, although underlying long-term support levels remain intact.
Earlier, analysts noted that Tesla was facing mixed technical momentum amid increased regulatory and legal challenges, prompting a cautious short-term outlook. Now, with stronger-than-expected Q1 earnings and sustained institutional interest supporting near-term technical strength, investors should monitor whether a decisive move above $423 triggers a renewed bullish leg or if persistent oscillator divergence signals another consolidation phase.


Latest Tesla News


-
 Afghanistan
-
 Albania
-
 Algeria
-
 Angola
-
 Argentina
-
 Armenia
-
 Australia
-
 Austria
-
 Azerbaijan
-
 Bahamas
-
 Bahrain
-
 Bangladesh
-
 Belarus
-
 Belgium
-
 Bolivia
-
 Botswana
-
 Brazil
-
 Brunei
-
 Bulgaria
-
 Cambodia
-
 Cameroon
-
 Canada
-
 Chile
Chile
-
 China
China
-
 Colombia
-
 Congo
Congo
-
 Costa Rica
-
 Cote d'Ivoire
-
 Croatia
-
 Cuba
Cuba
-
 Cyprus
-
 Czechia
-
 DR Congo
-
 Denmark
-
 Dominican Republic
-
 Ecuador
-
 Egypt
Egypt
-
 El Salvador
-
 Estonia
-
 Eswatini
-
 Ethiopia
-
 Finland
-
 France
-
 Georgia
-
 Germany
-
 Ghana
Ghana
-
 Greece
-
 Haiti
Haiti
-
 Hong Kong
-
 Hungary
-
 India
India
-
 Indonesia
-
 Iran, Islamic republic
-
 Iraq
Iraq
-
 Ireland
-
 Israel
-
 Italy
Italy
-
 Jamaica
-
 Japan
Japan
-
 Jordan
-
 Kazakhstan
-
 Kenya
Kenya
-
 Korea
Korea
-
 Kuwait
-
 Kyrgyzstan
-
 Laos
Laos
-
 Latvia
-
 Lebanon
-
 Lesotho
-
 Libya
Libya
-
 Lithuania
-
 Luxembourg
-
 Madagascar
-
 Malaysia
-
 Malta
Malta
-
 Mauritius
-
 Mexico
-
 Moldova
-
 Mongolia
-
 Montenegro
-
 Morocco
-
 Mozambique
-
 Myanmar
-
 Namibia
-
 Nepal
Nepal
-
 Netherlands
-
 New Zealand
-
 Nigeria
-
 North Macedonia
-
 Norway
-
 Oman
Oman
-
 Pakistan
-
 Palestine
-
 Panama
-
 Papua New Guinea
-
 Paraguay
-
 Peru
Peru
-
 Philippines
-
 Poland
-
 Portugal
-
 Puerto Rico
-
 Qatar
Qatar
-
 Reunion
-
 Romania
-
 Rwanda
-
 Saudi Arabia
-
 Serbia
-
 Singapore
-
 Slovakia
-
 Slovenia
-
 Somalia
-
 South Africa
-
 Spain
Spain
-
 Sri Lanka
-
 Sweden
-
 Switzerland
-
 Syria
Syria
-
 Taiwan
-
 Tajikistan
-
 Tanzania
-
 Thailand
-
 Trinidad and Tobago
-
 Tunisia
-
 Turkey
-
 UAE
UAE
-
 Uganda
-
 Ukraine
-
 United Kingdom
-
United States
-
 Uruguay
-
 Uzbekistan
-
 Venezuela
-
 Vietnam
-
 Yemen
Yemen
-
 Zambia
-
 Zimbabwe
- Forex
- Crypto
