
CME Group stock price forecast: $291.00 support comes into focus as CME slides 3.07%

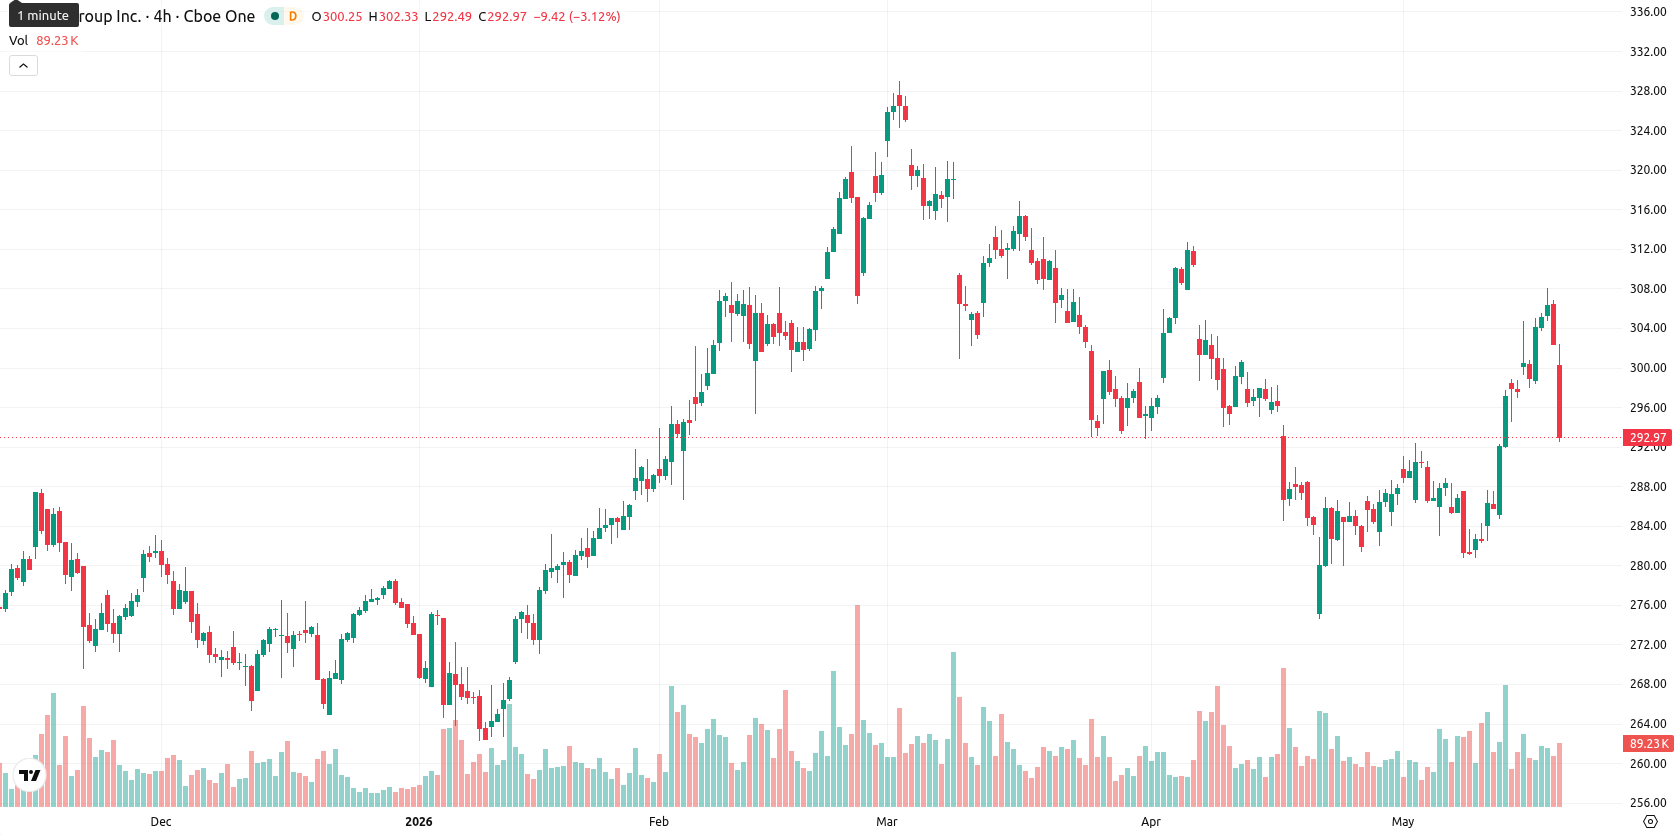
CME Group Inc. (CME) is trading at $293.08, down 3.07% on the day. The asset sits above its key short- and long-term moving averages but remains just below the intermediate-term trend average, positioning it under mild near-term pressure while retaining longer-term uptrend structure.
Highlights
- CME Group launched new futures contracts tied to computing power costs, expanding its derivatives reach into AI infrastructure risk management.
- Interactive Brokers integrated Kalshi’s prediction market, broadening client access to CME-listed contracts and potentially boosting trading volumes.
- Despite intraday losses and overbought short-term signals, CME’s medium- and long-term trend remains bullish with support at $291 and resistance at $297.
Portfolio expansion and inflows as downside pressure persists
CME Group and Silicon Data have completed the launch of new futures contracts enabling traders and corporate clients to manage risks associated with fluctuations in computing power costs, reflecting an expansion of the exchange's derivatives portfolio into artificial intelligence infrastructure. Interactive Brokers Group has begun incorporating Kalshi’s prediction market platform alongside traditional exchanges such as CME Group, extending accessibility to contracts listed by CME and potentially broadening trade volumes. The North Dakota State Investment Board reported a new holding in CME Group Inc., with the purchase of 12,333 shares valued at around $3.37 million, though price action has remained under broader selling pressure.
Bearish divergence emerges as momentum oscillators flag exhaustion
On the technical front, CME is trading just below its SMA-50 at $296.65, with immediate support marked by the Ichimoku Kijun level at $291.24 and a further key level at the SMA-200 of $282.60. Resistance stands close to $297, and support levels cluster near $291 and $282.50. Among indicators, ADX reflects a modest trend and MACD is neutral on the daily timeframe. RSI remains elevated, suggesting lingering buying interest, but both Stoch RSI and CCI indicate overbought conditions, flagging potential for short-term exhaustion. Bull/Bear Power (BBP) is overbought on the daily chart, while intraday signals have shifted to seller control. Current high volatility and a price drop to the day's lows highlight short-term bearish divergence against the medium-term trend.
High upside probability as price consolidates near resistance
Over the next week, CME is likely to fluctuate within a typical volatility band relative to current levels, estimated between $282.50 and $303.00. The expected scenario is a consolidation phase, with the price trading between support at $291 and resistance around $297. A break above $297 could initiate a move toward $303, while a fall below $291 would bring the $282.50 support into focus. The probability of a price increase is assessed as high, with declining scenarios seen as low likelihood.
Earlier, analysts noted that CME Group was exhibiting short-term upside enthusiasm despite lingering technical and macroeconomic pressures. Now, with new product launches and evolving market participation set against increased near-term volatility, traders should monitor for a decisive break above $297 or a potential retest of support near $282.50 as directional triggers.


Latest CME Group News


-
 Afghanistan
-
 Albania
-
 Algeria
-
 Angola
-
 Argentina
-
 Armenia
-
 Australia
-
 Austria
-
 Azerbaijan
-
 Bahamas
-
 Bahrain
-
 Bangladesh
-
 Belarus
-
 Belgium
-
 Bolivia
-
 Botswana
-
 Brazil
-
 Brunei
-
 Bulgaria
-
 Cambodia
-
 Cameroon
-
 Canada
-
 Chile
Chile
-
 China
China
-
 Colombia
-
 Congo
Congo
-
 Costa Rica
-
 Cote d'Ivoire
-
 Croatia
-
 Cuba
Cuba
-
 Cyprus
-
 Czechia
-
 DR Congo
-
 Denmark
-
 Dominican Republic
-
 Ecuador
-
 Egypt
Egypt
-
 El Salvador
-
 Estonia
-
 Eswatini
-
 Ethiopia
-
 Finland
-
 France
-
 Georgia
-
 Germany
-
 Ghana
Ghana
-
 Greece
-
 Haiti
Haiti
-
 Hong Kong
-
 Hungary
-
 India
India
-
 Indonesia
-
 Iran, Islamic republic
-
 Iraq
Iraq
-
 Ireland
-
 Israel
-
 Italy
Italy
-
 Jamaica
-
 Japan
Japan
-
 Jordan
-
 Kazakhstan
-
 Kenya
Kenya
-
 Korea
Korea
-
 Kuwait
-
 Kyrgyzstan
-
 Laos
Laos
-
 Latvia
-
 Lebanon
-
 Lesotho
-
 Libya
Libya
-
 Lithuania
-
 Luxembourg
-
 Madagascar
-
 Malaysia
-
 Malta
Malta
-
 Mauritius
-
 Mexico
-
 Moldova
-
 Mongolia
-
 Montenegro
-
 Morocco
-
 Mozambique
-
 Myanmar
-
 Namibia
-
 Nepal
Nepal
-
 Netherlands
-
 New Zealand
-
 Nigeria
-
 North Macedonia
-
 Norway
-
 Oman
Oman
-
 Pakistan
-
 Palestine
-
 Panama
-
 Papua New Guinea
-
 Paraguay
-
 Peru
Peru
-
 Philippines
-
 Poland
-
 Portugal
-
 Puerto Rico
-
 Qatar
Qatar
-
 Reunion
-
 Romania
-
 Rwanda
-
 Saudi Arabia
-
 Serbia
-
 Singapore
-
 Slovakia
-
 Slovenia
-
 Somalia
-
 South Africa
-
 Spain
Spain
-
 Sri Lanka
-
 Sweden
-
 Switzerland
-
 Syria
Syria
-
 Taiwan
-
 Tajikistan
-
 Tanzania
-
 Thailand
-
 Trinidad and Tobago
-
 Tunisia
-
 Turkey
-
 UAE
UAE
-
 Uganda
-
 Ukraine
-
 United Kingdom
-
United States
-
 Uruguay
-
 Uzbekistan
-
 Venezuela
-
 Vietnam
-
 Yemen
Yemen
-
 Zambia
-
 Zimbabwe
- Forex
- Crypto
