
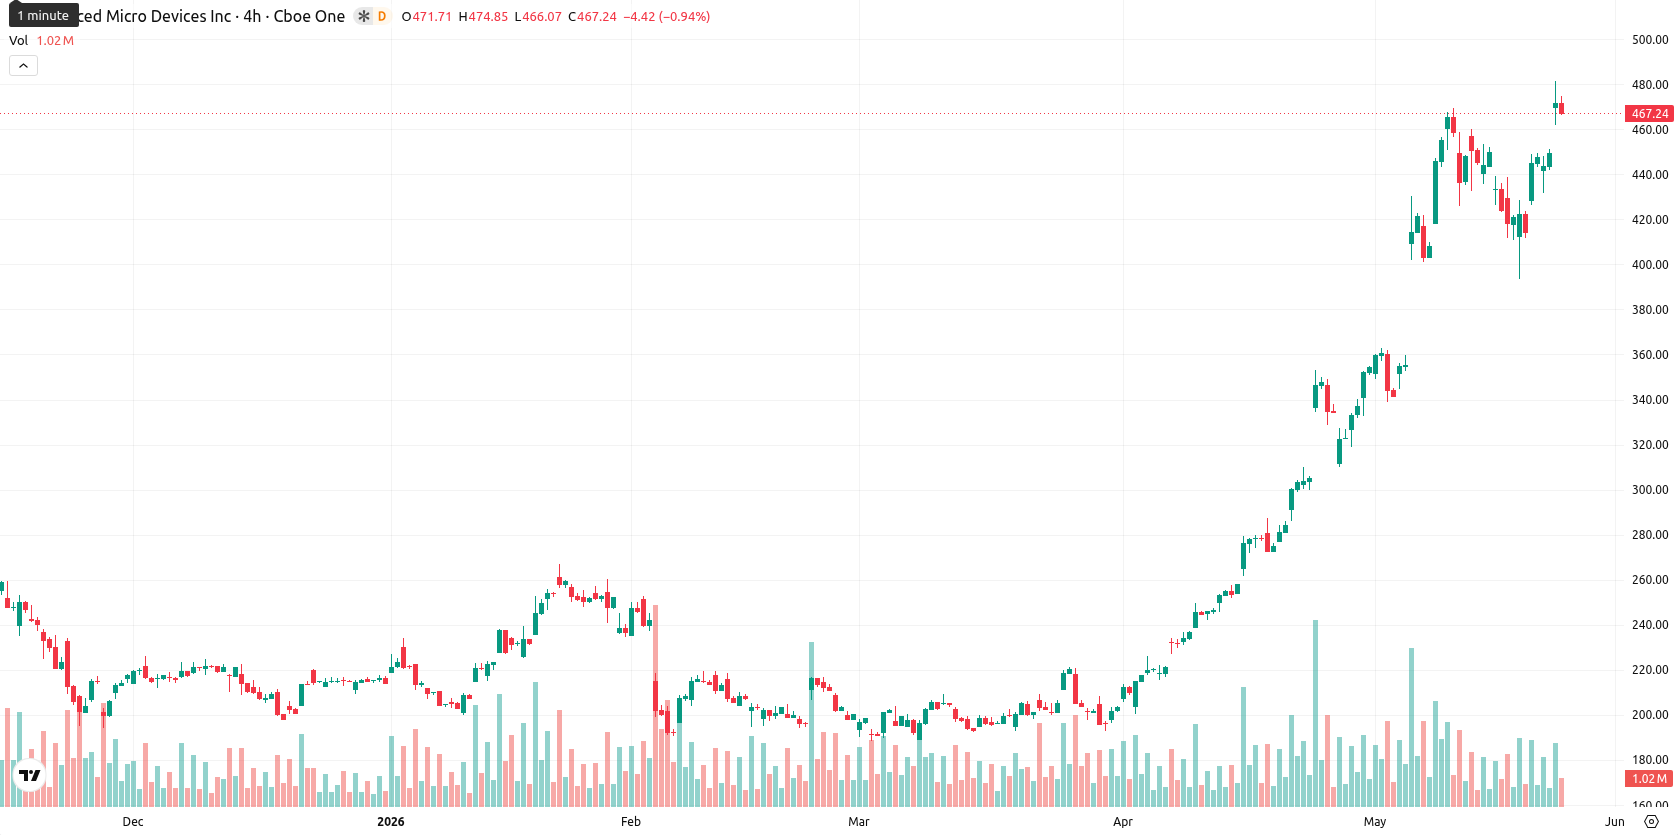
AMD stock price forecast: $485 resistance in focus as AMD advances 3.98%

Advanced Micro Devices, Inc. (AMD) stock is trading at $467.48, up 3.98% today. The price is well above its key moving averages, confirming strong upward momentum in the current session.
Highlights
- AMD displays strong bullish momentum with price sustaining above key short-, medium-, and long-term trend supports.
- Multiple technical indicators signal overbought conditions and persistent buyer dominance as intraday volatility remains elevated.
- AMD is expected to consolidate between $460 and $485 in the near term, with a high probability of further upside if buyers persist.
Extended bullish momentum as multiple signals reinforce overbought conditions
The SMA-20 is at $405.89, SMA-50 at $303.20, and SMA-200 at $230.87; AMD's price remains well above all these levels, reflecting recent crossovers and extended momentum. The Ichimoku Kijun line on D1 provides immediate support at $373.39. Momentum indicators are robust: MACD and ADX continue to show strong buy signals, RSI is elevated at 72.55, and CCI is nearing overbought territory. BBP signals overbought conditions, whereas the Awesome Oscillator remains neutral. Notably, today's session began with a nearly $18 gap-up, with the current price holding near the upper boundary of the $461.85–$474.77 range, highlighting high intraday volatility. The Stoch RSI provides a mixed signal with some divergence, but overall intraday momentum remains dominated by buyers.
Further gains likely as bullish trend consolidates near resistance
In the short term, AMD is expected to trade within a $460–$485 price band, consistent with recent volatility. Technical signals from the weekly timeframe are bullish across RSI, ADX, MACD, and the 50-day moving average, indicating an over 80% probability of further gains and a lower likelihood of a reversal. The baseline scenario is for AMD to consolidate between $460 and $485. Should bullish momentum persist and buyers maintain control, a breakout above $485 is possible, while any bearish scenario would require a sustained move below $460 support.
Previously it was reported that AMD was exhibiting strong bullish momentum, underpinned by investor optimism around its AI initiatives and strategic advancements. The current technical setup not only reinforces this positive outlook but also suggests that traders should monitor the $485 threshold for a potential breakout as bullish momentum persists.


Latest AMD News


-
 Afghanistan
-
 Albania
-
 Algeria
-
 Angola
-
 Argentina
-
 Armenia
-
 Australia
-
 Austria
-
 Azerbaijan
-
 Bahamas
-
 Bahrain
-
 Bangladesh
-
 Belarus
-
 Belgium
-
 Bolivia
-
 Botswana
-
 Brazil
-
 Brunei
-
 Bulgaria
-
 Cambodia
-
 Cameroon
-
 Canada
-
 Chile
Chile
-
 China
China
-
 Colombia
-
 Congo
Congo
-
 Costa Rica
-
 Cote d'Ivoire
-
 Croatia
-
 Cuba
Cuba
-
 Cyprus
-
 Czechia
-
 DR Congo
-
 Denmark
-
 Dominican Republic
-
 Ecuador
-
 Egypt
Egypt
-
 El Salvador
-
 Estonia
-
 Eswatini
-
 Ethiopia
-
 Finland
-
 France
-
 Georgia
-
 Germany
-
 Ghana
Ghana
-
 Greece
-
 Haiti
Haiti
-
 Hong Kong
-
 Hungary
-
 India
India
-
 Indonesia
-
 Iran, Islamic republic
-
 Iraq
Iraq
-
 Ireland
-
 Israel
-
 Italy
Italy
-
 Jamaica
-
 Japan
Japan
-
 Jordan
-
 Kazakhstan
-
 Kenya
Kenya
-
 Korea
Korea
-
 Kuwait
-
 Kyrgyzstan
-
 Laos
Laos
-
 Latvia
-
 Lebanon
-
 Lesotho
-
 Libya
Libya
-
 Lithuania
-
 Luxembourg
-
 Madagascar
-
 Malaysia
-
 Malta
Malta
-
 Mauritius
-
 Mexico
-
 Moldova
-
 Mongolia
-
 Montenegro
-
 Morocco
-
 Mozambique
-
 Myanmar
-
 Namibia
-
 Nepal
Nepal
-
 Netherlands
-
 New Zealand
-
 Nigeria
-
 North Macedonia
-
 Norway
-
 Oman
Oman
-
 Pakistan
-
 Palestine
-
 Panama
-
 Papua New Guinea
-
 Paraguay
-
 Peru
Peru
-
 Philippines
-
 Poland
-
 Portugal
-
 Puerto Rico
-
 Qatar
Qatar
-
 Reunion
-
 Romania
-
 Rwanda
-
 Saudi Arabia
-
 Serbia
-
 Singapore
-
 Slovakia
-
 Slovenia
-
 Somalia
-
 South Africa
-
 Spain
Spain
-
 Sri Lanka
-
 Sweden
-
 Switzerland
-
 Syria
Syria
-
 Taiwan
-
 Tajikistan
-
 Tanzania
-
 Thailand
-
 Trinidad and Tobago
-
 Tunisia
-
 Turkey
-
 UAE
UAE
-
 Uganda
-
 Ukraine
-
 United Kingdom
-
United States
-
 Uruguay
-
 Uzbekistan
-
 Venezuela
-
 Vietnam
-
 Yemen
Yemen
-
 Zambia
-
 Zimbabwe
- Forex
- Crypto
