
Shopify stock edges higher as buyers show interest above $101 support

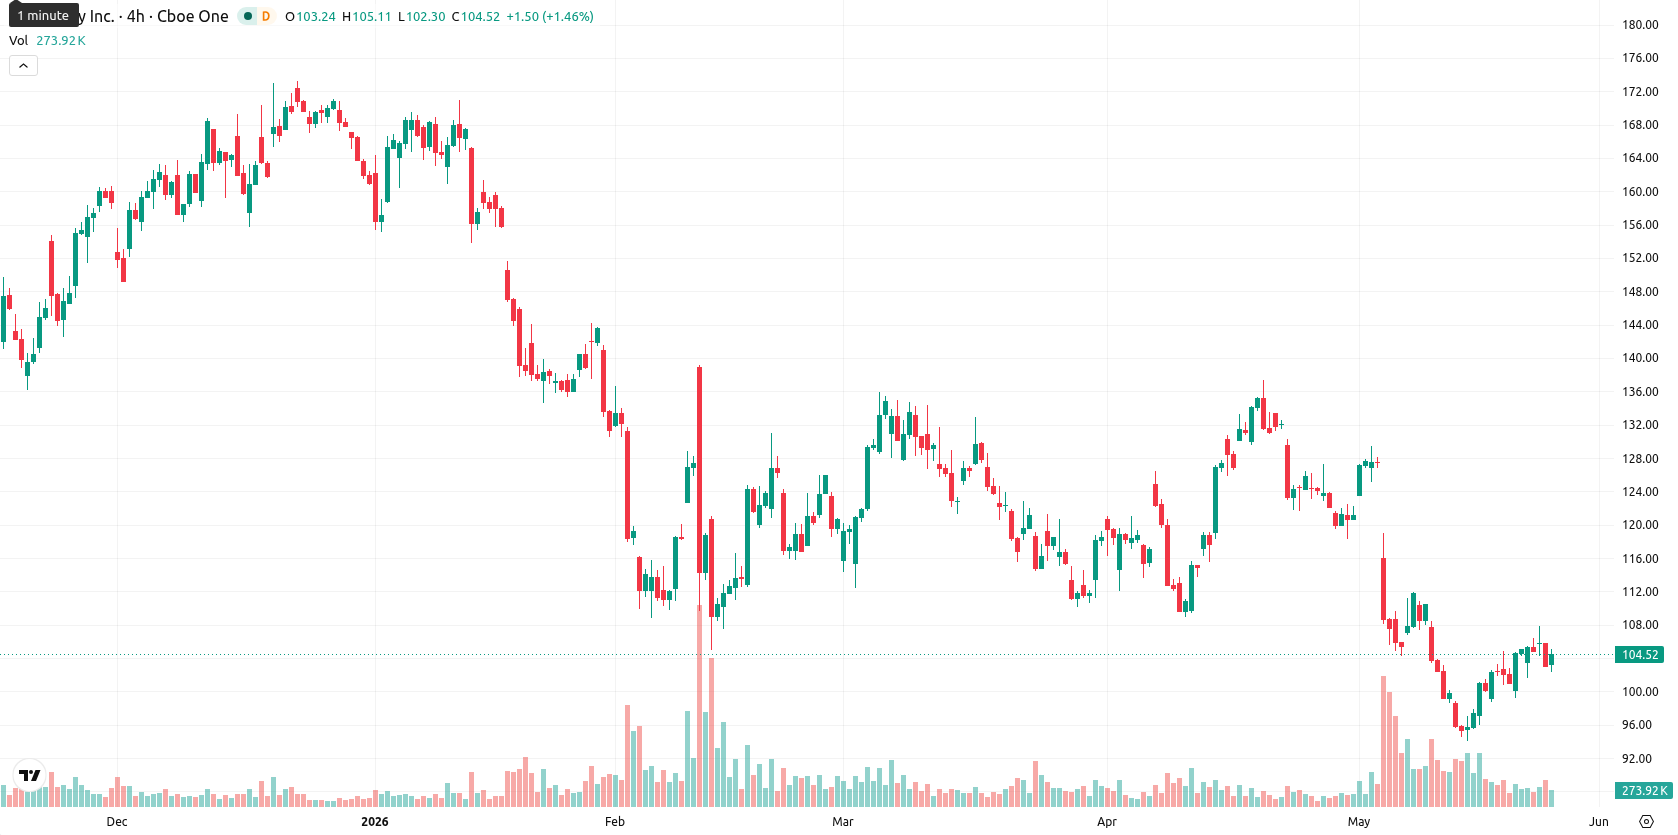
Shopify Inc. (SHOP) stock is trading at $104.34, up 1.30% for the day. Price action remains below its key moving averages, indicating a short-term rally within a broader corrective phase.
Highlights
- Shopify trades below key moving averages, signaling sustained bearish momentum across short, medium, and long-term horizons.
- Technical indicators show conflicting signals with weak momentum, overbought short-term conditions, and limited directional conviction.
- Expected five-day price corridor is $101.00–$107.00, with downside risk prevailing unless price overcomes immediate resistance near $115.65.
Mixed momentum as resistance aligns with weak trend signals
The $104.34 level for SHOP places it below the MA-20 ($109.51), MA-50 ($116.52), and MA-200 ($140.38). The daily Ichimoku Kijun sits higher at $115.65, forming immediate resistance, with next potential upside capped at this area. Momentum indicators reveal mixed dynamics: the D1 MACD issues a strong sell, while the ADX reads a low, neutral value of 17.09, indicating a lack of directional strength. Oscillators are divergent, as the RSI at 41.44 leans bearish while the Stoch RSI signals overbought (84.63); CCI remains neutral and BBP (0.54) suggests intraday buying interest dominating for the session.
Sideways price likely as momentum lacks conviction
Over the next five trading days, typical volatility is expected to keep SHOP stock within a $101.00–$107.00 price corridor. The baseline scenario is for sideways fluctuation in this range in the absence of clear momentum, with a less than 20% probability of sustained upside. A move above immediate resistance at $115.65 could trigger a test of the $107.00 zone, while a break below $101.00 may prompt accelerated downside toward lower supports.
Earlier, analysts noted that value-focused retailers can demonstrate resilience even in challenging consumer and market environments. In Shopify's case, a lack of clear directional strength and mixed short-term momentum indicators suggest that traders should closely monitor price action for a confirmed break above resistance or a move below $101.00, as either could signal the next meaningful trend.


-
 Afghanistan
-
 Albania
-
 Algeria
-
 Angola
-
 Argentina
-
 Armenia
-
 Australia
-
 Austria
-
 Azerbaijan
-
 Bahamas
-
 Bahrain
-
 Bangladesh
-
 Belarus
-
 Belgium
-
 Bolivia
-
 Botswana
-
 Brazil
-
 Brunei
-
 Bulgaria
-
 Cambodia
-
 Cameroon
-
 Canada
-
 Chile
Chile
-
 China
China
-
 Colombia
-
 Congo
Congo
-
 Costa Rica
-
 Cote d'Ivoire
-
 Croatia
-
 Cuba
Cuba
-
 Cyprus
-
 Czechia
-
 DR Congo
-
 Denmark
-
 Dominican Republic
-
 Ecuador
-
 Egypt
Egypt
-
 El Salvador
-
 Estonia
-
 Eswatini
-
 Ethiopia
-
 Finland
-
 France
-
 Georgia
-
 Germany
-
 Ghana
Ghana
-
 Greece
-
 Haiti
Haiti
-
 Hong Kong
-
 Hungary
-
 India
India
-
 Indonesia
-
 Iran, Islamic republic
-
 Iraq
Iraq
-
 Ireland
-
 Israel
-
 Italy
Italy
-
 Jamaica
-
 Japan
Japan
-
 Jordan
-
 Kazakhstan
-
 Kenya
Kenya
-
 Korea
Korea
-
 Kuwait
-
 Kyrgyzstan
-
 Laos
Laos
-
 Latvia
-
 Lebanon
-
 Lesotho
-
 Libya
Libya
-
 Lithuania
-
 Luxembourg
-
 Madagascar
-
 Malaysia
-
 Malta
Malta
-
 Mauritius
-
 Mexico
-
 Moldova
-
 Mongolia
-
 Montenegro
-
 Morocco
-
 Mozambique
-
 Myanmar
-
 Namibia
-
 Nepal
Nepal
-
 Netherlands
-
 New Zealand
-
 Nigeria
-
 North Macedonia
-
 Norway
-
 Oman
Oman
-
 Pakistan
-
 Palestine
-
 Panama
-
 Papua New Guinea
-
 Paraguay
-
 Peru
Peru
-
 Philippines
-
 Poland
-
 Portugal
-
 Puerto Rico
-
 Qatar
Qatar
-
 Reunion
-
 Romania
-
 Rwanda
-
 Saudi Arabia
-
 Serbia
-
 Singapore
-
 Slovakia
-
 Slovenia
-
 Somalia
-
 South Africa
-
 Spain
Spain
-
 Sri Lanka
-
 Sweden
-
 Switzerland
-
 Syria
Syria
-
 Taiwan
-
 Tajikistan
-
 Tanzania
-
 Thailand
-
 Trinidad and Tobago
-
 Tunisia
-
 Turkey
-
 UAE
UAE
-
 Uganda
-
 Ukraine
-
 United Kingdom
-
United States
-
 Uruguay
-
 Uzbekistan
-
 Venezuela
-
 Vietnam
-
 Yemen
Yemen
-
 Zambia
-
 Zimbabwe
- Forex
- Crypto
