
+7.88% for SoFi stock as stablecoin launch draws investor attention

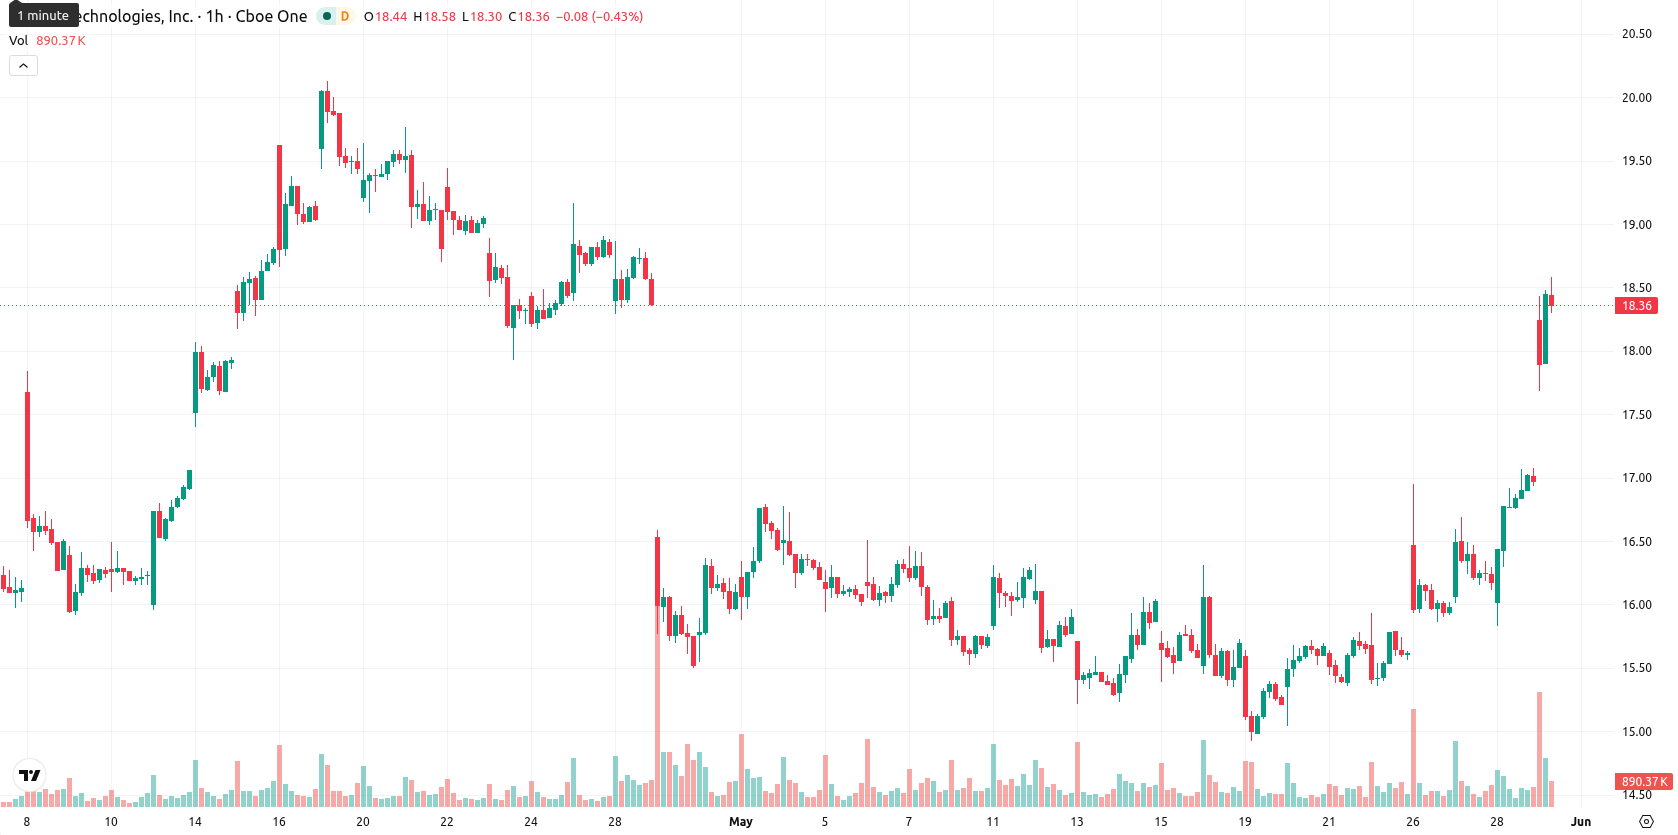
SoFi Technologies, Inc. (SOFI) stock is trading at $18.34, up 7.88% on the day and sitting above its key short- and medium-term moving averages, though it remains below long-term trend levels.
Highlights
- SoFi launched SoFiUSD, the first stablecoin by a U.S. national bank, expanding digital asset offerings for 15 million users.
- Q1 2026 adjusted net revenue reached $1.1 billion, surpassing expectations and underscoring strong member and product growth.
- SOFI trades with short-term bullish momentum and overbought signals, likely to consolidate between $17.00 and $19.20 in the near term.
Stablecoin launch and earnings beat drive SoFi product expansion
SoFi Technologies has introduced SoFiUSD, the first stablecoin issued by a U.S. national bank, making it available to nearly 15 million members through its mobile app. This move positions SoFi as an innovative leader in digital assets, expands its product offering, and creates new pathways for user deposits and engagement. SoFiUSD is currently live on Ethereum and Solana with additional network support planned, and the company intends to make tokenized deposits with interest and FDIC insurance available in the future. Additionally, SoFi reported Q1 2026 adjusted net revenue of $1.1 billion, exceeding expectations and highlighting robust member and product growth.
Mixed momentum as SOFI stalls below long-term technical resistance
Technically, SOFI is trading above its SMA-20 ($15.95) and SMA-50 ($16.69), both of which are acting as dynamic support, but remains well beneath the longer-term SMA-200 ($23.24). The Ichimoku Kijun stands at $17.18, now providing immediate support, while intraday action began with a gap up from $17.00 to $17.95, with price currently near the day's high of $18.58. Momentum signals are mixed: the MACD on the daily time frame is still in a strong sell position, while the ADX reads as neutral with limited directional conviction. Meanwhile, oscillators such as RSI (55.79), Stoch RSI (100.00), and CCI (150.51) signify overbought conditions, suggesting potential upward exhaustion. BBP readings show buyers dominating intraday activity, with the Awesome Oscillator staying neutral and session volatility remaining elevated.
Sideways bias dominates as volatility band contains breakout risks
Over the next five trading days, the typical volatility band is expected to range from $17.00 to $19.20 based on recent price action and indicator readings. There is a low probability (less than 20%) of a sustained breakout above this range, making a decline more likely if price fails to hold support levels. Baseline expectations point to sideways consolidation near current prices, with a bullish scenario involving a break above $19.20 on continued intraday strength, and a bearish case materializing if support at $17.18 is lost, potentially leading to a retest of $17.00 or lower.
Earlier, analysts noted that SoFi’s launch of SoFiUSD and strong earnings had positioned the company as an innovative leader in digital banking while driving short-term optimism in the stock. The current market setup reinforces this narrative and suggests that, with volatility expected to persist, traders should monitor the $17.18 support level closely as a decisive break below it could signal the start of a downside move.


-
 Afghanistan
-
 Albania
-
 Algeria
-
 Angola
-
 Argentina
-
 Armenia
-
 Australia
-
 Austria
-
 Azerbaijan
-
 Bahamas
-
 Bahrain
-
 Bangladesh
-
 Belarus
-
 Belgium
-
 Bolivia
-
 Botswana
-
 Brazil
-
 Brunei
-
 Bulgaria
-
 Cambodia
-
 Cameroon
-
 Canada
-
 Chile
Chile
-
 China
China
-
 Colombia
-
 Congo
Congo
-
 Costa Rica
-
 Cote d'Ivoire
-
 Croatia
-
 Cuba
Cuba
-
 Cyprus
-
 Czechia
-
 DR Congo
-
 Denmark
-
 Dominican Republic
-
 Ecuador
-
 Egypt
Egypt
-
 El Salvador
-
 Estonia
-
 Eswatini
-
 Ethiopia
-
 Finland
-
 France
-
 Georgia
-
 Germany
-
 Ghana
Ghana
-
 Greece
-
 Haiti
Haiti
-
 Hong Kong
-
 Hungary
-
 India
India
-
 Indonesia
-
 Iran, Islamic republic
-
 Iraq
Iraq
-
 Ireland
-
 Israel
-
 Italy
Italy
-
 Jamaica
-
 Japan
Japan
-
 Jordan
-
 Kazakhstan
-
 Kenya
Kenya
-
 Korea
Korea
-
 Kuwait
-
 Kyrgyzstan
-
 Laos
Laos
-
 Latvia
-
 Lebanon
-
 Lesotho
-
 Libya
Libya
-
 Lithuania
-
 Luxembourg
-
 Madagascar
-
 Malaysia
-
 Malta
Malta
-
 Mauritius
-
 Mexico
-
 Moldova
-
 Mongolia
-
 Montenegro
-
 Morocco
-
 Mozambique
-
 Myanmar
-
 Namibia
-
 Nepal
Nepal
-
 Netherlands
-
 New Zealand
-
 Nigeria
-
 North Macedonia
-
 Norway
-
 Oman
Oman
-
 Pakistan
-
 Palestine
-
 Panama
-
 Papua New Guinea
-
 Paraguay
-
 Peru
Peru
-
 Philippines
-
 Poland
-
 Portugal
-
 Puerto Rico
-
 Qatar
Qatar
-
 Reunion
-
 Romania
-
 Rwanda
-
 Saudi Arabia
-
 Serbia
-
 Singapore
-
 Slovakia
-
 Slovenia
-
 Somalia
-
 South Africa
-
 Spain
Spain
-
 Sri Lanka
-
 Sweden
-
 Switzerland
-
 Syria
Syria
-
 Taiwan
-
 Tajikistan
-
 Tanzania
-
 Thailand
-
 Trinidad and Tobago
-
 Tunisia
-
 Turkey
-
 UAE
UAE
-
 Uganda
-
 Ukraine
-
 United Kingdom
-
United States
-
 Uruguay
-
 Uzbekistan
-
 Venezuela
-
 Vietnam
-
 Yemen
Yemen
-
 Zambia
-
 Zimbabwe
- Forex
- Crypto
