

Microsoft stock climbs after GPU financing agreement with IREN Limited

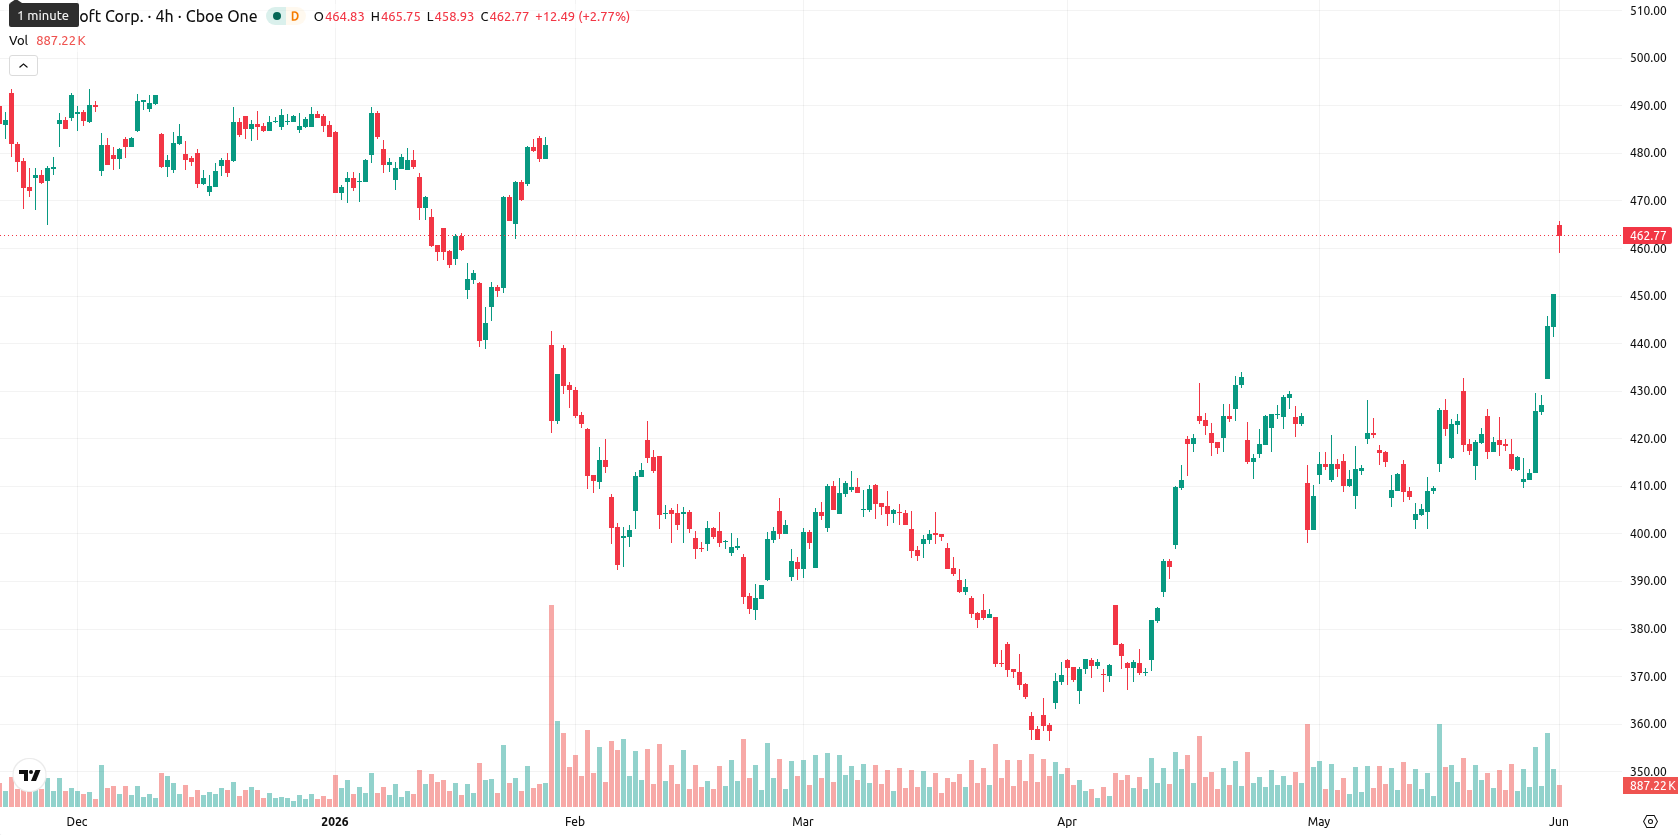
Microsoft (MSFT) stock is trading at $448.28, up 4.99% on the day. The price currently sits above its key short- and medium-term moving averages, indicating upside momentum relative to recent trends.
 551.08
542.67
551.08
542.67
Highlights
- Microsoft faces heightened antitrust scrutiny from the Federal Trade Commission, raising legal and operational risk for its cloud and licensing businesses.
- Despite regulatory pressures, Microsoft is advancing AI Cloud growth with a multi-billion dollar GPU financing deal to expand data center capacity.
- Technicals show strong short- and medium-term bullish momentum, but overbought signals suggest a likely sideways or lower move within the $446.50–$455.50 range.
Regulatory risks rise as cloud expansion spurs scrutiny
Regulatory pressure on Microsoft is intensifying as the Federal Trade Commission escalates its antitrust investigation into the company’s licensing and cloud business, directly increasing potential legal and operational risks. This heightened scrutiny builds on Microsoft’s recent history with government challenges, particularly following the Activision Blizzard acquisition, and could impact investor perception by raising uncertainty about future business practices. Simultaneously, Microsoft’s expansion of data center infrastructure through a new multi-billion dollar GPU financing contract with IREN Limited is enabling further growth in its AI Cloud operations, signaling ongoing strategic investment despite the regulatory backdrop.
Overbought signals escalate as bullish momentum faces reversal risk
From a technical perspective, MSFT is positioned above the MA-20 ($417.39) and MA-50 ($402.73), while remaining below the MA-200 ($458.43). Immediate support is marked by the Ichimoku Kijun level at $424.10. On the daily chart, the MACD shows a buy signal and ADX is neutral. RSI stands just below overbought at 69.05, while Stoch RSI and CCI are fully overbought, highlighting excessive optimism. The BBP indicator confirms strong buyer dominance within the session, with trading activity opening well above the previous close and maintaining elevated volatility near session highs. Despite bullish momentum, the presence of multiple overbought indicators and divergence suggests increasing risk of a reversal.
Sideways outlook expected as resistance limits upside breakout
Over the coming week, MSFT is likely to trade within a typical volatility band of $446.50 to $455.50, centered near current levels. Price increase probability is low (under 20%), making a sideways scenario the baseline expectation. Upside potential would require a confident daily close above $455.50, whereas failure of support at $446.50 could trigger a bearish move.
Earlier, analysts noted that major tech companies such as Alphabet were facing increased market scrutiny over aggressive AI-related investments and mounting regulatory risks. In Microsoft's case, the convergence of heightened antitrust pressure and ongoing large-scale infrastructure spending underscores the importance of monitoring both $455.50 as a key resistance level and the risk of a reversal driven by overbought conditions in the short term.





Latest Microsoft News





-
 Afghanistan
-
 Albania
-
 Algeria
-
 Angola
-
 Argentina
-
 Armenia
-
 Australia
-
 Austria
-
 Azerbaijan
-
 Bahamas
-
 Bahrain
-
 Bangladesh
-
 Belarus
-
 Belgium
-
 Bolivia
-
 Botswana
-
 Brazil
-
 Brunei
-
 Bulgaria
-
 Cambodia
-
 Cameroon
-
 Canada
-
 Chile
Chile
-
 China
China
-
 Colombia
-
 Congo
Congo
-
 Costa Rica
-
 Cote d'Ivoire
-
 Croatia
-
 Cuba
Cuba
-
 Cyprus
-
 Czechia
-
 DR Congo
-
 Denmark
-
 Dominican Republic
-
 Ecuador
-
 Egypt
Egypt
-
 El Salvador
-
 Estonia
-
 Eswatini
-
 Ethiopia
-
 Finland
-
 France
-
 Georgia
-
 Germany
-
 Ghana
Ghana
-
 Greece
-
 Haiti
Haiti
-
 Hong Kong
-
 Hungary
-
 India
India
-
 Indonesia
-
 Iran, Islamic republic
-
 Iraq
Iraq
-
 Ireland
-
 Israel
-
 Italy
Italy
-
 Jamaica
-
 Japan
Japan
-
 Jordan
-
 Kazakhstan
-
 Kenya
Kenya
-
 Korea
Korea
-
 Kuwait
-
 Kyrgyzstan
-
 Laos
Laos
-
 Latvia
-
 Lebanon
-
 Lesotho
-
 Libya
Libya
-
 Lithuania
-
 Luxembourg
-
 Madagascar
-
 Malaysia
-
 Malta
Malta
-
 Mauritius
-
 Mexico
-
 Moldova
-
 Mongolia
-
 Montenegro
-
 Morocco
-
 Mozambique
-
 Myanmar
-
 Namibia
-
 Nepal
Nepal
-
 Netherlands
-
 New Zealand
-
 Nigeria
-
 North Macedonia
-
 Norway
-
 Oman
Oman
-
 Pakistan
-
 Palestine
-
 Panama
-
 Papua New Guinea
-
 Paraguay
-
 Peru
Peru
-
 Philippines
-
 Poland
-
 Portugal
-
 Puerto Rico
-
 Qatar
Qatar
-
 Reunion
-
 Romania
-
 Rwanda
-
 Saudi Arabia
-
 Serbia
-
 Singapore
-
 Slovakia
-
 Slovenia
-
 Somalia
-
 South Africa
-
 Spain
Spain
-
 Sri Lanka
-
 Sweden
-
 Switzerland
-
 Syria
Syria
-
 Taiwan
-
 Tajikistan
-
 Tanzania
-
 Thailand
-
 Trinidad and Tobago
-
 Tunisia
-
 Turkey
-
 UAE
UAE
-
 Uganda
-
 Ukraine
-
 United Kingdom
-
United States
-
 Uruguay
-
 Uzbekistan
-
 Venezuela
-
 Vietnam
-
 Yemen
Yemen
-
 Zambia
-
 Zimbabwe
- Forex
- Crypto












